Question
I would like you to make an effort to calculate the WACC for Marriott overall which requires following a couple of steps:
- First, we need to unlever Marriott's Equity Beta with the actual debt ratio and relever the unlevered asset beta with the target debt ratio.
- Second, calculate the cost of equity using CAPM.
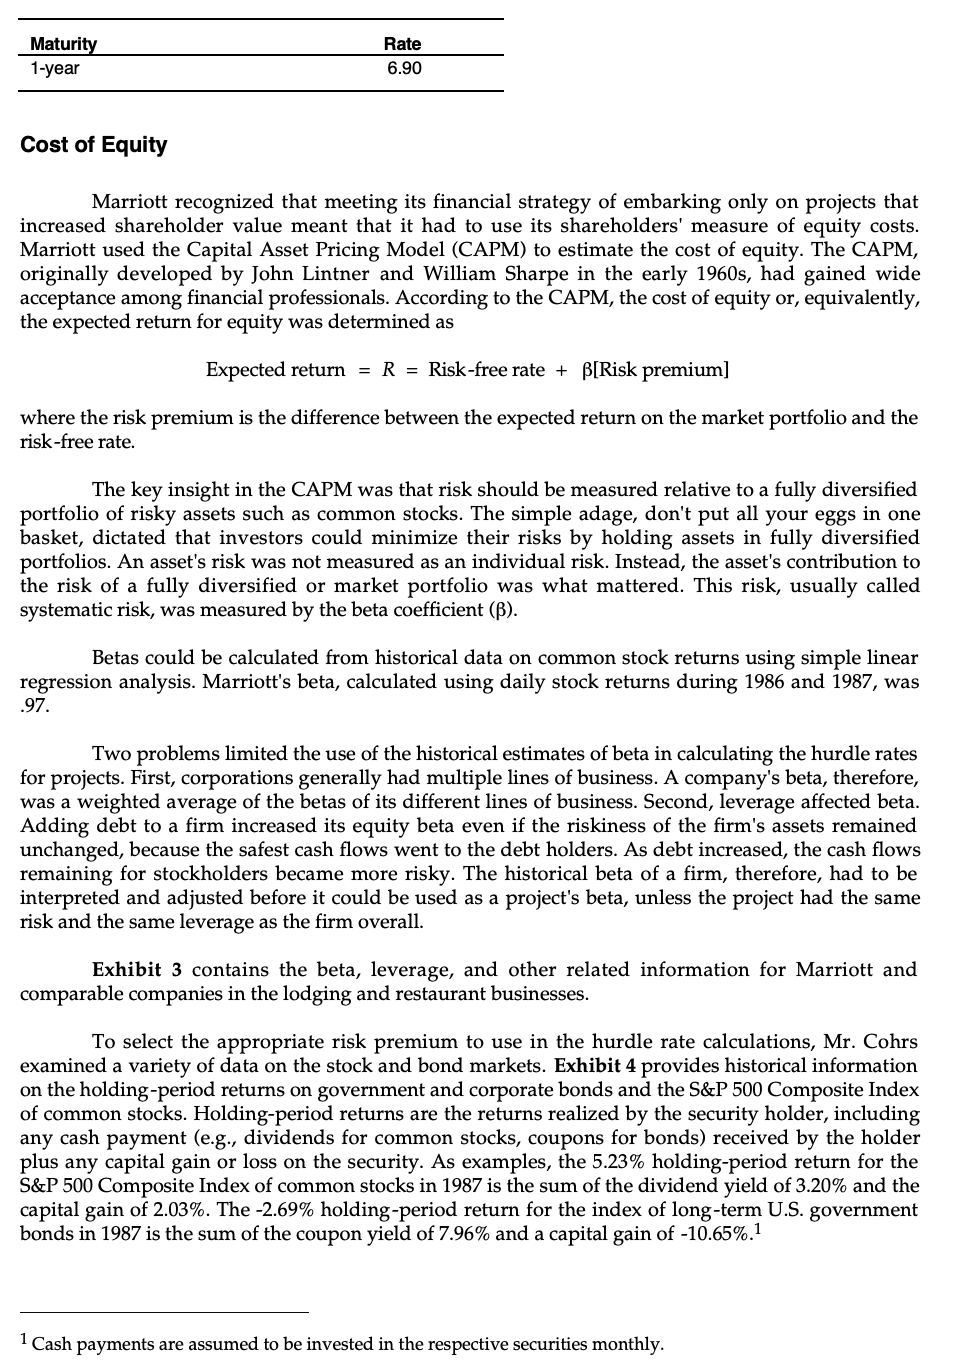
- Third estimate the firm's cost of debt using the yield data in the case.
- Finally, estimate their WACC.
- After that is done, go through the same steps to calculate the WACC for the lodging and restaurant divisions using their respective comparable firms to estimate an average asset beta.
- Since there are no comparable firms for the contract services, consider how you might estimate their WACC using what you know about the other two divisions.
Case
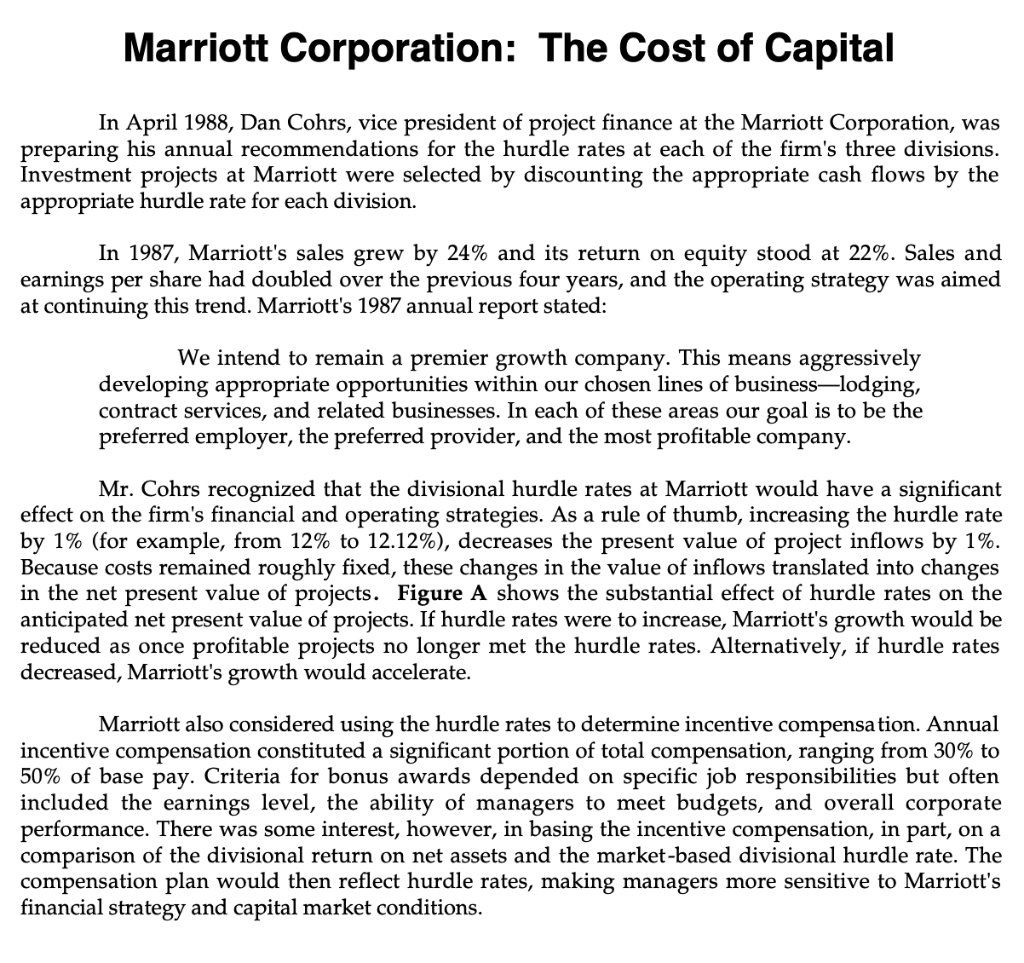
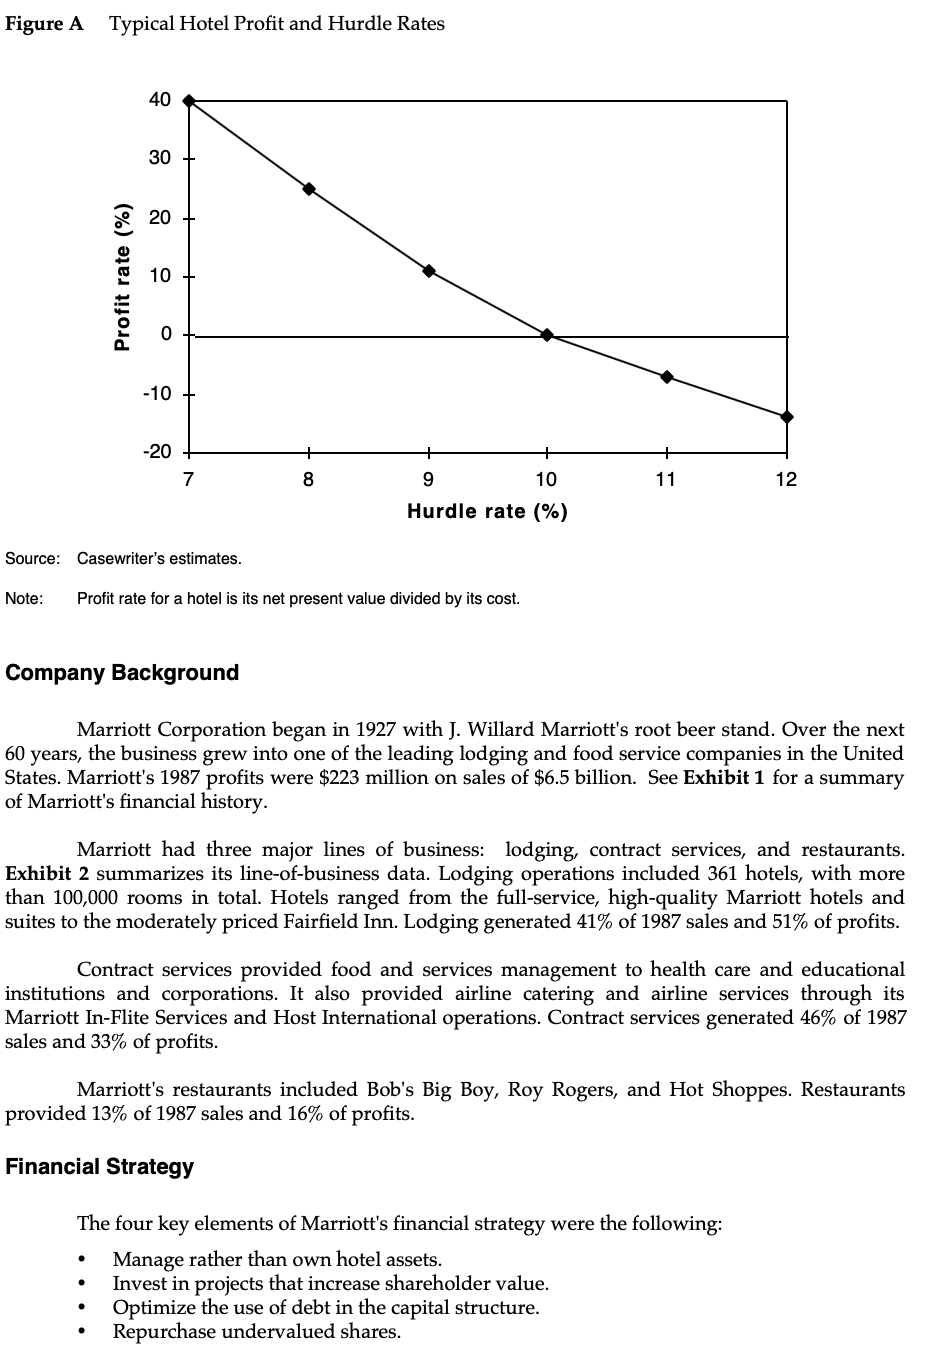
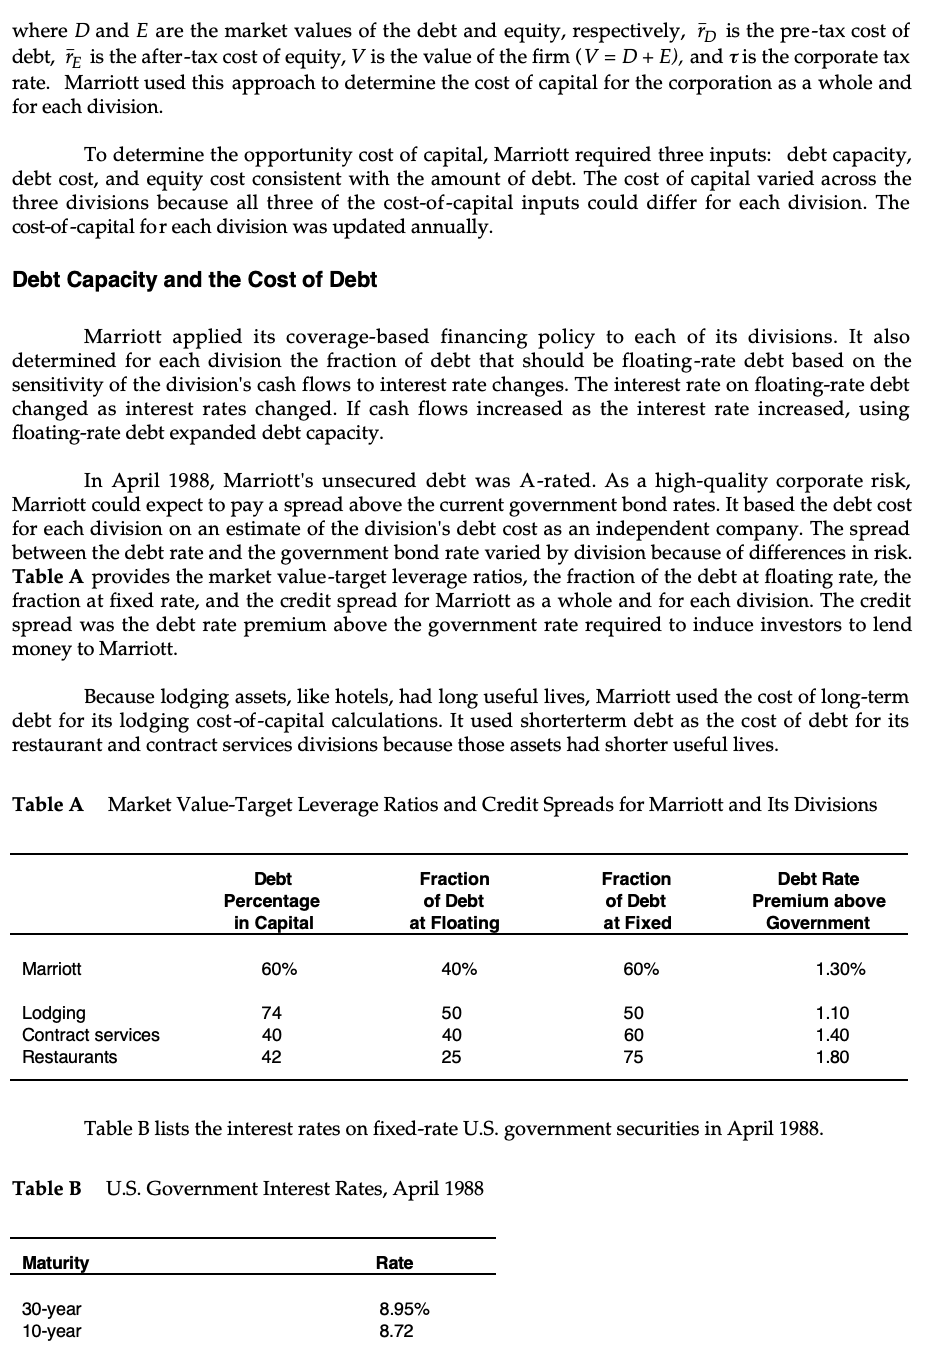
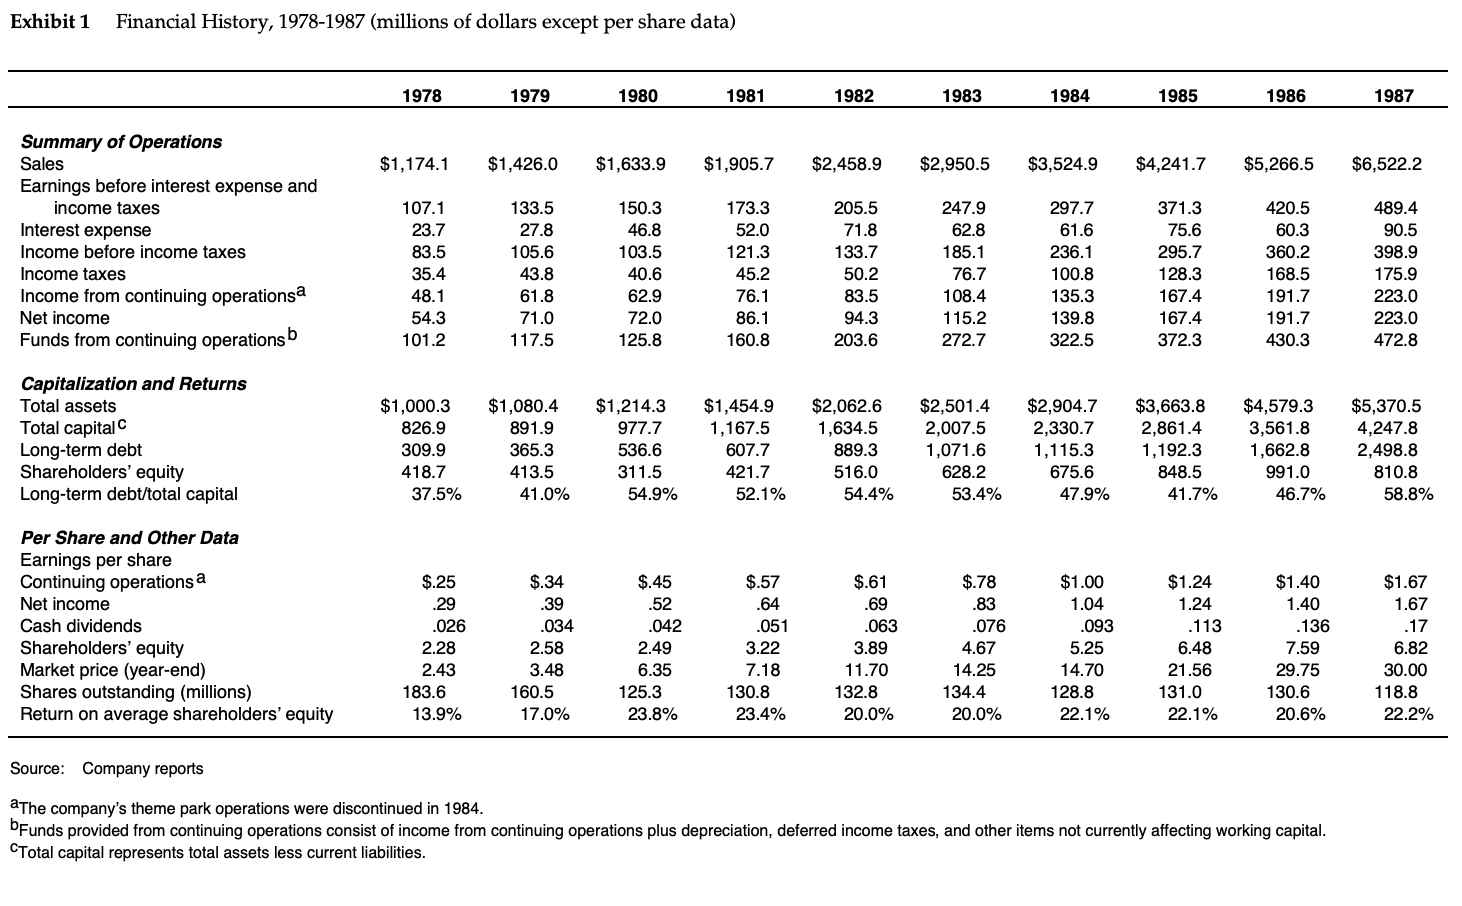
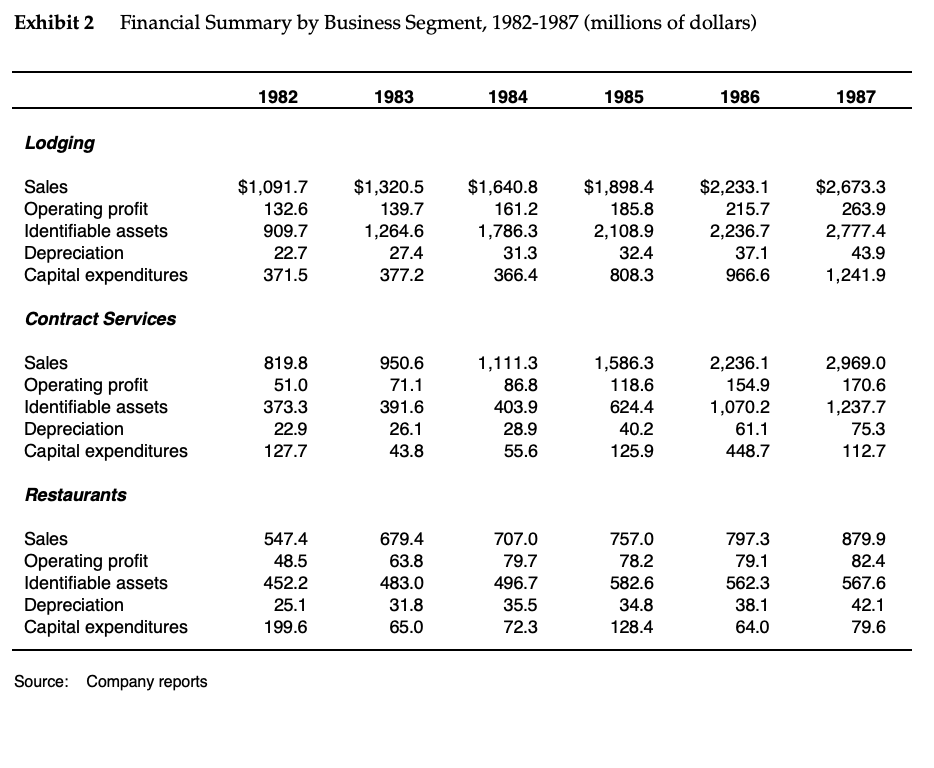
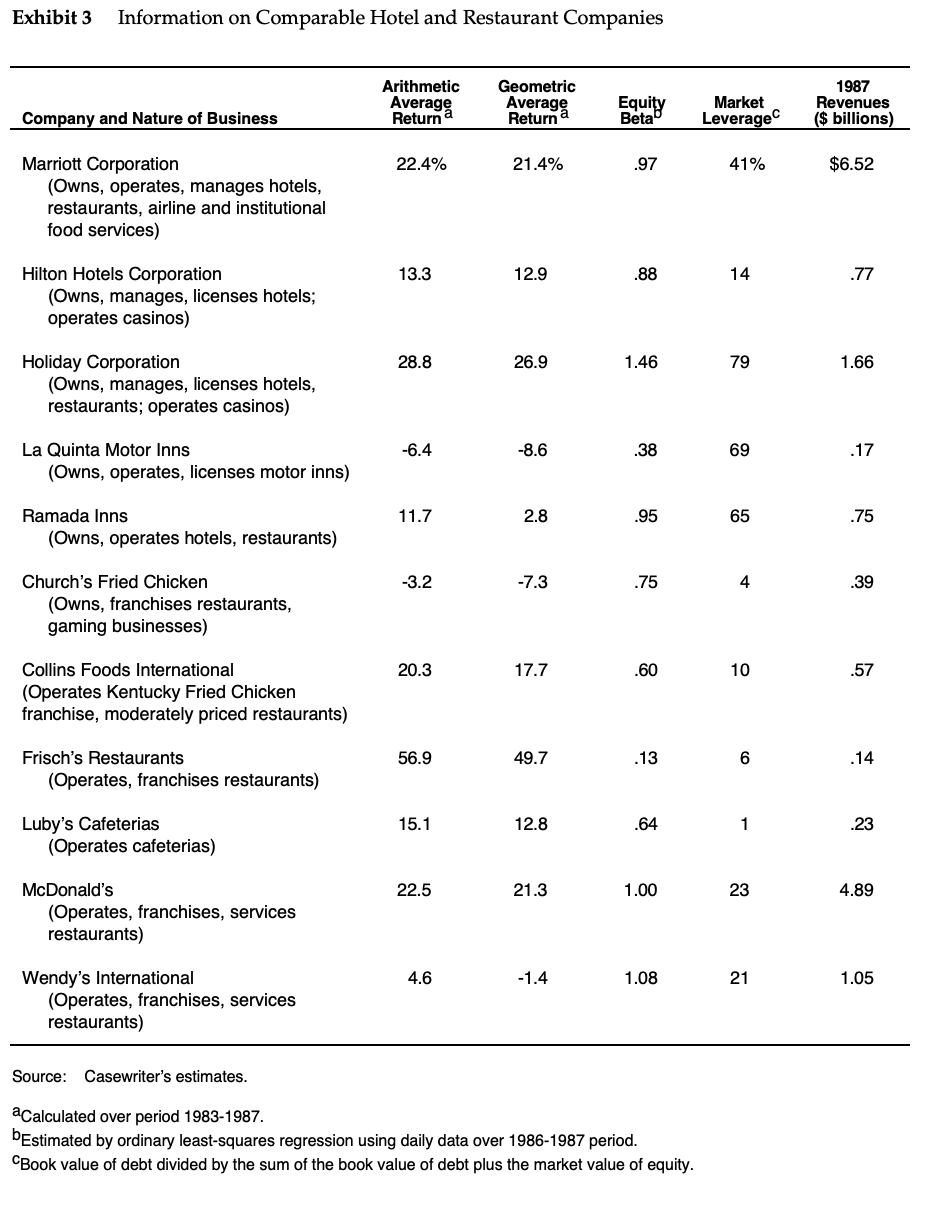
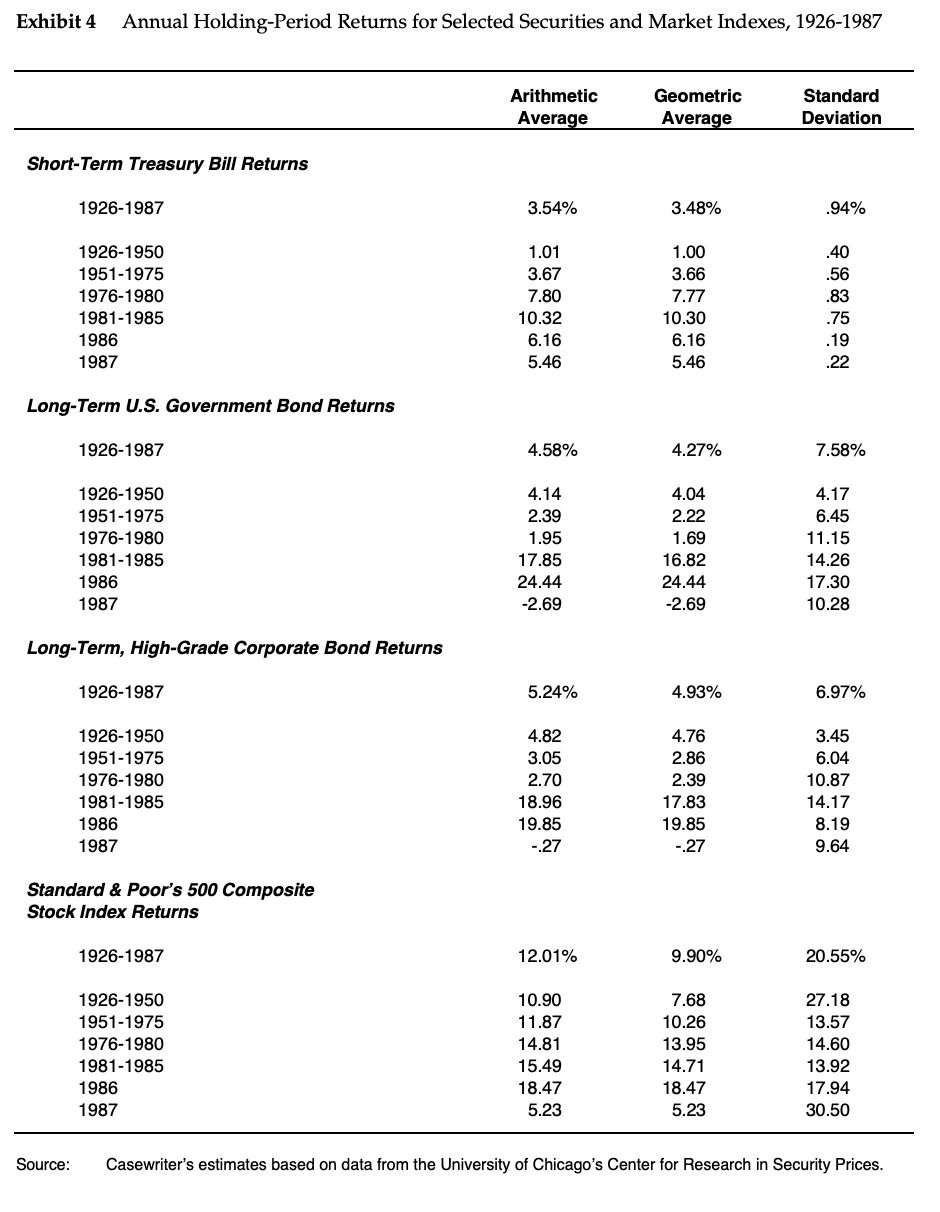
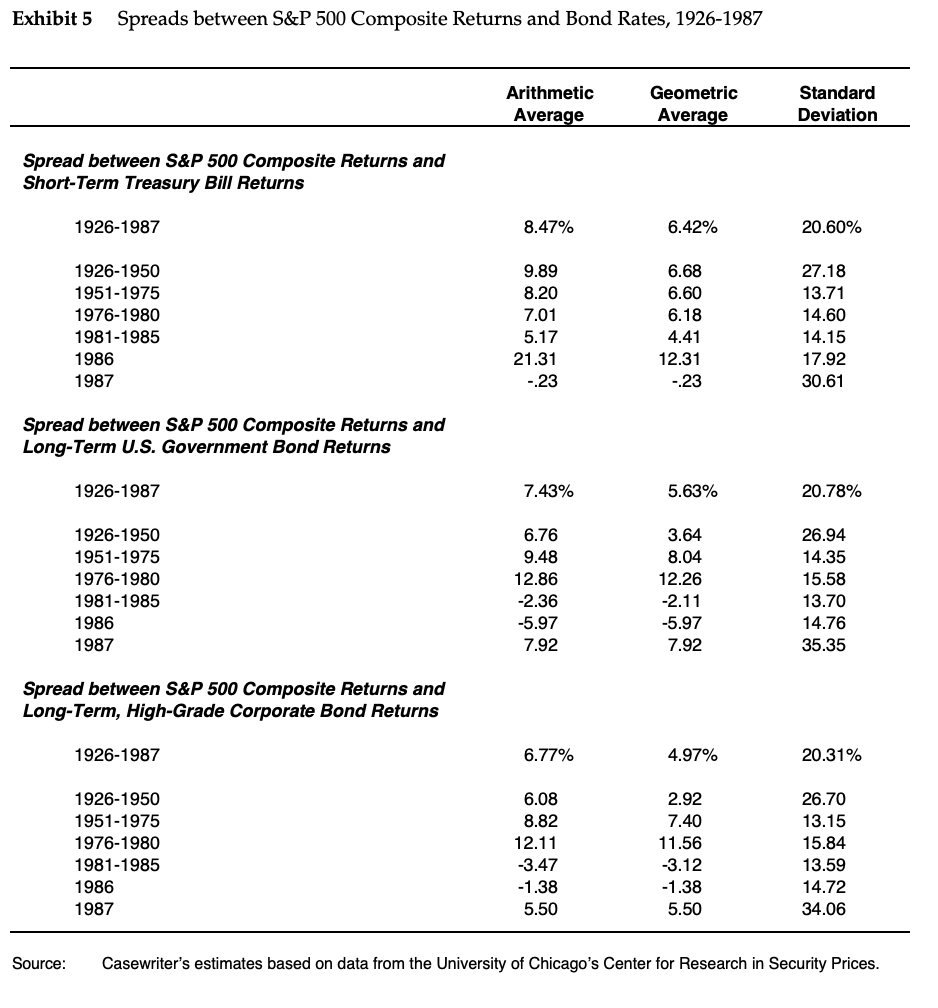
Marriott Corporation: The Cost of Capital In April 1988, Dan Cohrs, vice president of project finance at the Marriott Corporation, was preparing his annual recommendations for the hurdle rates at each of the firm's three divisions. Investment projects at Marriott were selected by discounting the appropriate cash flows by the appropriate hurdle rate for each division. In 1987, Marriott's sales grew by 24% and its return on equity stood at 22%. Sales and earnings per share had doubled over the previous four years, and the operating strategy was aimed at continuing this trend. Marriott's 1987 annual report stated: We intend to remain a premier growth company. This means aggressively developing appropriate opportunities within our chosen lines of businesslodging, contract services, and related businesses. In each of these areas our goal is to be the preferred employer, the preferred provider, and the most profitable company. Mr. Cohrs recognized that the divisional hurdle rates at Marriott would have a significant effect on the firm's financial and operating strategies. As a rule of thumb, increasing the hurdle rate by 1% (for example, from 12% to 12.12%), decreases the present value of project inflows by 1%. Because costs remained roughly fixed, these changes in the value of inflows translated into changes in the net present value of projects. Figure A shows the substantial effect of hurdle rates on the anticipated net present value of projects. If hurdle rates were to increase, Marriott's growth would be reduced as once profitable projects no longer met the hurdle rates. Alternatively, if hurdle rates decreased, Marriott's growth would accelerate. Marriott also considered using the hurdle rates to determine incentive compensation. Annual incentive compensation constituted a significant portion of total compensation, ranging from 30% to 50% of base pay. Criteria for bonus awards depended on specific job responsibilities but often included the earnings level, the ability of managers to meet budgets, and overall corporate performance. There was some interest, however, in basing the incentive compensation, in part, on a comparison of the divisional return on net assets and the market-based divisional hurdle rate. The compensation plan would then reflect hurdle rates, making managers more sensitive to Marriott's financial strategy and capital market conditions. Figure A Typical Hotel Profit and Hurdle Rates 40 30 20 Profit rate (%) 10 0 -10 -20 7 8 + 9 10 Hurdle rate (%) 11 12 Source: Casewriter's estimates. Note: Profit rate for a hotel is its net present value divided by its cost. Company Background Marriott Corporation began in 1927 with J. Willard Marriott's root beer stand. Over the next 60 years, the business grew into one of the leading lodging and food service companies in the United States. Marriott's 1987 profits were $223 million on sales of $6.5 billion. See Exhibit 1 for a summary of Marriott's financial history. Marriott had three major lines of business: lodging, contract services, and restaurants. Exhibit 2 summarizes its line-of-business data. Lodging operations included 361 hotels, with more than 100,000 rooms in total. Hotels ranged from the full-service, high-quality Marriott hotels and suites to the moderately priced Fairfield Inn. Lodging generated 41% of 1987 sales and 51% of profits. Contract services provided food and services management to health care and educational institutions and corporations. It also provided airline catering and airline services through its Marriott In-Flite Services and Host International operations. Contract services generated 46% of 1987 sales and 33% of profits. Marriott's restaurants included Bob's Big Boy, Roy Rogers, and Hot Shoppes. Restaurants provided 13% of 1987 sales and 16% of profits. Financial Strategy The four key elements of Marriott's financial strategy were the following: Manage rather than own hotel assets. Invest in projects that increase shareholder value. Optimize the use of debt in the capital structure. Repurchase undervalued shares. Manage rather than own hotel assets In 1987, Marriott developed more than $1 billion worth of hotel properties, making it one of the 10 largest commercial real estate developers in the United States. With a fully integrated development process, Marriott identified markets, created development plans, designed projects, and evaluated potential profitability. After development, the company sold the hotel assets to limited partners while retaining operating control as the general partner under a long-term management contract. Management fees typically equaled 3% of revenues plus 20% of the profits before depreciation and debt service. The 3% of revenues usually covered the overhead cost of managing the hotel. Marriott's 20% of profits before depreciation and debt service often required it to stand aside until investors earned a prespecified return. Marriott also guaranteed a portion of the partnership's debt. During 1987 3 Marriott hotels and 70 Courtyard hotels were syndicated for $890 million. In total, the company operated about $7 billion worth of syndicated hotels. Invest in projects that increase shareholder value The company used discounted cash flow techniques to evaluate potential investments. The hurdle rate assigned to a specific project was based on market interest rates, project risk, and estimates of risk premiums. Cash flow forecasts incorporated standard companywide assumptions that limited discretion in cash flow estimates and instilled some consistency across projects. As one Marriott executive put it, Our projects are like a lot of similar little boxes. This similarity disciplines the pro forma analysis. There are corporate macro data on inflation, margins, project lives, terminal values, percent of sales required to remodel, and so on. Projects are audited throughout their lives to check and update these standard pro forma template assumptions. Divisional managers still have discretion over unit-specific assumptions, but they must conform to the corporate templates. Optimize the use of debt in the capital structure Marriott determined the amount of debt in its capital structure by focusing on its ability to service its debt. It used an interest coverage target instead of a target debt-to-equity ratio. In 1987, Marriott had about $2.5 billion of debt, 59% of its total capital Repurchase undervalued shares Marriott regularly calculated a "warranted equity value" for its common shares and was committed to repurchasing its stock whenever its market price fell substantially below that value. The warranted equity value was calculated by discounting the equity cash flows of the firm using the equity cost of capital for the company. It was checked by paring Marriott's stock price with that of comparable companies using price-earnings ratios for each business and by valuing each business under alternative ownership structures, such as a leveraged buyout. Marriott had more confidence in its measure of warranted value than in the day-to-day market price of its stock. A gap between warranted value and market price, therefore, usually triggered repurchases instead of a revision in the warranted value by, for example, revising the hurdle rate. Furthermore, the company believed that repurchases of shares below warranted equity value were a better use of its cash flow and debt capacity than acquisitions or owning real estate. In 1987, Marriott repurchased 13.6 million shares of its common stock for $429 million. Cost of Capital Marriott measured the opportunity cost of capital for investments of similar risk using the weighted average cost of capital (WACC): WACC (1 t)(D/V) + PE(EIV) where D and E are the market values of the debt and equity, respectively, p is the pre-tax cost of debt, Te is the after-tax cost of equity, V is the value of the firm (V = D + E), and t is the corporate tax rate. Marriott used this approach to determine the cost of capital for the corporation as a whole and for each division. To determine the opportunity cost of capital, Marriott required three inputs: debt capacity, debt cost, and equity cost consistent with the amount of debt. The cost of capital varied across the three divisions because all three of the cost-of-capital inputs could differ for each division. The cost-of-capital for each division was updated annually. Debt Capacity and the Cost of Debt Marriott applied its coverage-based financing policy to each of its divisions. It also determined for each division the fraction of debt that should be floating-rate debt based on the sensitivity of the division's cash flows to interest rate changes. The interest rate on floating-rate debt changed as interest rates changed. If cash flows increased as the interest rate increased, using floating-rate debt expanded debt capacity. In April 1988, Marriott's unsecured debt was A-rated. As a high-quality corporate risk, Marriott could expect to pay a spread above the current government bond rates. It based the debt cost for each division on an estimate of the division's debt cost as an independent company. The spread between the debt rate and the government bond rate varied by division because of differences in risk. Table A provides the market value-target leverage ratios, the fraction of the debt at floating rate, the fraction at fixed rate, and the credit spread for Marriott as a whole and for each division. The credit spread was the debt rate premium above the government rate required to induce investors to lend money to Marriott. Because lodging assets, like hotels, had long useful lives, Marriott used the cost of long-term debt for its lodging cost-of-capital calculations. It used shorterterm debt as the cost of debt for its restaurant and contract services divisions because those assets had shorter useful lives. Table A Market Value-Target Leverage Ratios and Credit Spreads for Marriott and Its Divisions Debt Percentage in Capital Fraction of Debt at Floating Fraction of Debt at Fixed Debt Rate Premium above Government Marriott 60% 40% 60% 1.30% Lodging Contract services Restaurants 74 40 42 50 40 25 50 60 75 1.10 1.40 1.80 Table B lists the interest rates on fixed-rate U.S. government securities in April 1988. Table B U.S. Government Interest Rates, April 1988 Maturity Rate 30-year 10-year 8.95% 8.72 Maturity 1-year Rate 6.90 Cost of Equity Marriott recognized that meeting its financial strategy of embarking only on projects that increased shareholder value meant that it had to use its shareholders' measure of equity costs. Marriott used the Capital Asset Pricing Model (CAPM) to estimate the cost of equity. The CAPM, originally developed by John Lintner and William Sharpe in the early 1960s, had gained wide acceptance among financial professionals. According to the CAPM, the cost of equity or, equivalently, the expected return for equity was determined as Expected return = R = Risk-free rate + b[Risk premium] where the risk premium is the difference between the expected return on the market portfolio and the risk-free rate. The key insight in the CAPM was that risk should be measured relative to a fully diversified portfolio of risky assets such as common stocks. The simple adage, don't put all your eggs in one basket, dictated that investors could minimize their risks by holding assets in fully diversified portfolios. An asset's risk was not measured as an individual risk. Instead, the asset's contribution to the risk of a fully diversified or market portfolio was what mattered. This risk, usually called systematic risk, was measured by the beta coefficient (B). Betas could be calculated from historical data on common stock returns using simple linear regression analysis. Marriott's beta, calculated using daily stock returns during 1986 and 1987, was .97 Two problems limited the use of the historical estimates of beta in calculating the hurdle rates for projects. First, corporations generally had multiple lines of business. A company's beta, therefore, was a weighted average of the betas of its different lines of business. Second, leverage affected beta. Adding debt to a firm increased its equity beta even if the riskiness of the firm's assets remained unchanged, because the safest cash flows went to the debt holders. As debt increased, the cash flows remaining for stockholders became more risky. The historical beta of a firm, therefore, had to be interpreted and adjusted before it could be used as a project's beta, unless the project had the same risk and the same leverage as the firm overall. Exhibit 3 contains the beta, leverage, and other related information for Marriott and comparable companies in the lodging and restaurant businesses. To select the appropriate risk premium to use in the hurdle rate calculations, Mr. Cohrs examined a variety of data on the stock and bond markets. Exhibit 4 provides historical information on the holding-period returns on government and corporate bonds and the S&P 500 Composite Index of common stocks. Holding-period returns are the returns realized by the security holder, including any cash payment (e.g., dividends for common stocks, coupons for bonds) received by the holder plus any capital gain or loss on the security. As examples, the 5.23% holding-period return for the S&P 500 Composite Index of common stocks in 1987 is the sum of the dividend yield of 3.20% and the capital gain of 2.03%. The -2.69% holding-period return for the index of long-term U.S. government bonds in 1987 is the sum of the coupon yield of 7.96% and a capital gain of -10.65%.1 1 Cash payments are assumed to be invested in the respective securities monthly. Exhibit 5 provides statistics on the spread between the S&P 500 Composite returns and the holding-period returns on Treasury bills, U.S. government bonds, and high-grade, long-term corporate bonds. Mr. Cohrs was concerned about the correct time interval to measure these averages, especially given the high returns and volatility of the bond markets shown in Exhibits 4 and 5. He was concerned also about which measure of expected returns should be used. Exhibits 4 and 5 present two different measures of average annual return, the arithmetic and the geometric. The arithmetic average return is the sum of the annual returns over the time period divided by the number of years in the time interval. The geometric average return is the compound average growth rate over the time interval. For example, if the return for a security were - 10% in period I and 30% in period 2, the two averages would be Arithmetic average : (-10% + 30%)/2 = 10.0%) Geometric average: (.9)(1.3) - 1 = 8.2% Exhibit 1 Financial History, 1978-1987 (millions of dollars except per share data) 1978 1979 1980 1981 1982 1983 1984 1985 1986 1987 $1,174.1 $1,426.0 $1,633.9 $1,905.7 $2,458.9 $2,950.5 $3,524.9 $4,241.7 $5,266.5 $6,522.2 Summary of Operations Sales Earnings before interest expense and income taxes Interest expense Income before income taxes Income taxes Income from continuing operationsa Net income Funds from continuing operationsb 107.1 23.7 83.5 35.4 48.1 54.3 101.2 133.5 27.8 105.6 43.8 61.8 71.0 117.5 150.3 46.8 103.5 40.6 62.9 72.0 173.3 52.0 121.3 45.2 76.1 86.1 160.8 205.5 71.8 133.7 50.2 83.5 94.3 203.6 247.9 62.8 185.1 76.7 108.4 115.2 272.7 297.7 61.6 236.1 100.8 135.3 139.8 322.5 371.3 75.6 295.7 128.3 167.4 167.4 372.3 420.5 60.3 360.2 168.5 191.7 191.7 430.3 489.4 90.5 398.9 175.9 223.0 223.0 472.8 125.8 Capitalization and Returns Total assets Total capital Long-term debt Shareholders' equity Long-term debt/total capital $1,000.3 826.9 309.9 418.7 37.5% $1,080.4 891.9 365.3 413.5 41.0% $1,214.3 977.7 536.6 311.5 54.9% $1,454.9 1,167.5 607.7 421.7 52.1% $2,062.6 1,634.5 889.3 516.0 54.4% $2,501.4 2,007.5 1,071.6 628.2 53.4% $2,904.7 2,330.7 1,115.3 675.6 47.9% $3,663.8 2,861.4 1,192.3 848.5 41.7% $4,579.3 3,561.8 1,662.8 991.0 46.7% $5,370.5 4,247.8 2,498.8 810.8 58.8% $1.24 1.24 Per Share and Other Data Earnings per share Continuing operations a Net income Cash dividends Shareholders' equity Market price (year-end) Shares outstanding (millions) Return on average shareholders' equity $.25 .29 .026 2.28 2.43 183.6 13.9% $.34 .39 .034 2.58 3.48 160.5 17.0% $.45 .52 .042 2.49 6.35 125.3 23.8% $.57 .64 .051 3.22 7.18 130.8 23.4% $.61 .69 .063 3.89 11.70 132.8 20.0% $.78 .83 .076 4.67 14.25 134.4 20.0% $1.00 1.04 .093 5.25 14.70 128.8 22.1% .113 6.48 21.56 131.0 22.1% $1.40 1.40 . 136 7.59 29.75 130.6 20.6% $1.67 1.67 .17 6.82 30.00 118.8 22.2% Source: Company reports aThe company's theme park operations were discontinued in 1984. bFunds provided from continuing operations consist of income from continuing operations plus depreciation, deferred income taxes, and other items not currently affecting working capital. Total capital represents total assets less current liabilities. Exhibit 2 Financial Summary by Business Segment, 1982-1987 (millions of dollars) 1982 1983 1984 1985 1986 1987 Lodging Sales Operating profit Identifiable assets Depreciation Capital expenditures $1,091.7 132.6 909.7 22.7 371.5 $1,320.5 139.7 1,264.6 27.4 377.2 $1,640.8 161.2 1,786.3 31.3 366.4 $1,898.4 185.8 2,108.9 32.4 808.3 $2,233.1 215.7 2,23 37.1 966.6 $2,673.3 263.9 2,777.4 43.9 1,241.9 Contract Services Sales Operating profit Identifiable assets Depreciation Capital expenditures 819.8 51.0 373.3 22.9 127.7 950.6 71.1 391.6 26.1 43.8 1,111.3 86.8 403.9 28.9 55.6 1,586.3 118.6 624.4 40.2 125.9 2,236.1 154.9 1,070.2 61.1 448.7 2,969.0 170.6 1,237.7 75.3 112.7 Restaurants Sales Operating profit Identifiable assets Depreciation Capital expenditures 547.4 48.5 452.2 25.1 199.6 679.4 63.8 483.0 31.8 65.0 707.0 79.7 496.7 35.5 72.3 757.0 78.2 582.6 34.8 128.4 797.3 79.1 562.3 38.1 64.0 879.9 82.4 567.6 42.1 79.6 Source: Company reports Exhibit 3 Information on Comparable Hotel and Restaurant Companies Arithmetic Average Return a Geometric Average Return a Equity Beta 1987 Revenues ($ billions) Market Leverage Company and Nature of Business 22.4% 21.4% .97 41% $6.52 Marriott Corporation (Owns, operates, manages hotels, restaurants, airline and institutional food services) 13.3 12.9 .88 14 .77 Hilton Hotels Corporation (Owns, manages, licenses hotels; operates casinos) 28.8 26.9 1.46 79 1.66 Holiday Corporation (Owns, manages, licenses hotels, restaurants; operates casinos) -6.4 -8.6 .38 69 .17 La Quinta Motor Inns (Owns, operates, licenses motor inns) 11.7 2.8 .95 65 .75 Ramada Inns (Owns, operates hotels, restaurants) -3.2 -7.3 .75 4 .39 Church's Fried Chicken (Owns, franchises restaurants, gaming businesses) 20.3 17.7 .60 10 .57 Collins Foods International (Operates Kentucky Fried Chicken franchise, moderately priced restaurants) 56.9 49.7 .13 6 .14 Frisch's Restaurants (Operates, franchises restaurants) 15.1 12.8 .64 1 .23 Luby's Cafeterias (Operates cafeterias) 22.5 21.3 1.00 23 4.89 McDonald's (Operates, franchises, services restaurants) 4.6 -1.4 1.08 21 1.05 Wendy's International (Operates, franchises, services restaurants) Source: Casewriter's estimates. aCalculated over period 1983-1987. bEstimated by ordinary least-squares regression using daily data over 1986-1987 period. CBook value of debt divided by the sum of the book value of debt plus the market value of equity. Exhibit 4 Annual Holding-Period Returns for Selected Securities and Market Indexes, 1926-1987 Arithmetic Average Geometric Average Standard Deviation Short-Term Treasury Bill Returns 1926-1987 3.54% 3.48% .94% 1926-1950 1951-1975 1976-1980 1981-1985 1986 1987 1.01 3.67 7.80 10.32 6.16 5.46 1.00 3.66 7.77 10.30 6.16 5.46 .40 .56 .83 .75 .19 .22 Long-Term U.S. Government Bond Returns 1926-1987 4.58% 4.27% 7.58% 4.14 2.39 1926-1950 1951-1975 1976-1980 1981-1985 1986 1987 1.95 17.85 24.44 -2.69 4.04 2.22 1.69 16.82 24.44 -2.69 4.17 6.45 11.15 14.26 17.30 10.28 Long-Term, High-Grade Corporate Bond Returns 1926-1987 5.24% 4.93% 6.97% 1926-1950 1951-1975 1976-1980 1981-1985 1986 1987 4.82 3.05 2.70 18.96 19.85 -.27 4.76 2.86 2.39 17.83 19.85 -.27 3.45 6.04 10.87 14.17 8.19 9.64 Standard & Poor's 500 Composite Stock Index Returns 1926-1987 12.01% 9.90% 20.55% 1926-1950 1951-1975 1976-1980 1981-1985 1986 1987 10.90 11.87 14.81 15.49 18.47 5.23 7.68 10.26 13.95 14.71 18.47 5.23 27.18 13.57 14.60 13.92 17.94 30.50 Source: Casewriter's estimates based on data from the University of Chicago's Center for Research in Security Prices. Exhibit 5 Spreads between S&P 500 Composite Returns and Bond Rates, 1926-1987 Arithmetic Average Geometric Average Standard Deviation Spread between S&P 500 Composite Returns and Short-Term Treasury Bill Returns 1926-1987 8.47% 6.42% 20.60% 1926-1950 1951-1975 1976-1980 1981-1985 1986 1987 9.89 8.20 7.01 5.17 21.31 - 23 6.68 6.60 6.18 4.41 12.31 -.23 27.18 13.71 14.60 14.15 17.92 30.61 Spread between S&P 500 Composite Returns and Long-Term U.S. Government Bond Returns 1926-1987 7.43% 5.63% 20.78% 1926-1950 1951-1975 1976-1980 1981-1985 1986 1987 6.76 9.48 12.86 -2.36 -5.97 7.92 3.64 8.04 12.26 -2.11 -5.97 7.92 26.94 14.35 15.58 13.70 14.76 35.35 Spread between S&P 500 Composite Returns and Long-Term, High-Grade Corporate Bond Returns 1926-1987 6.77% 4.97% 20.31% 1926-1950 1951-1975 1976-1980 1981-1985 1986 1987 6.08 8.82 12.11 -3.47 -1.38 5.50 2.92 7.40 11.56 -3.12 -1.38 5.50 26.70 13.15 15.84 13.59 14.72 34.06 Source: Casewriter's estimates based on data from the University of Chicago's Center for Research in Security Prices. Marriott Corporation: The Cost of Capital In April 1988, Dan Cohrs, vice president of project finance at the Marriott Corporation, was preparing his annual recommendations for the hurdle rates at each of the firm's three divisions. Investment projects at Marriott were selected by discounting the appropriate cash flows by the appropriate hurdle rate for each division. In 1987, Marriott's sales grew by 24% and its return on equity stood at 22%. Sales and earnings per share had doubled over the previous four years, and the operating strategy was aimed at continuing this trend. Marriott's 1987 annual report stated: We intend to remain a premier growth company. This means aggressively developing appropriate opportunities within our chosen lines of businesslodging, contract services, and related businesses. In each of these areas our goal is to be the preferred employer, the preferred provider, and the most profitable company. Mr. Cohrs recognized that the divisional hurdle rates at Marriott would have a significant effect on the firm's financial and operating strategies. As a rule of thumb, increasing the hurdle rate by 1% (for example, from 12% to 12.12%), decreases the present value of project inflows by 1%. Because costs remained roughly fixed, these changes in the value of inflows translated into changes in the net present value of projects. Figure A shows the substantial effect of hurdle rates on the anticipated net present value of projects. If hurdle rates were to increase, Marriott's growth would be reduced as once profitable projects no longer met the hurdle rates. Alternatively, if hurdle rates decreased, Marriott's growth would accelerate. Marriott also considered using the hurdle rates to determine incentive compensation. Annual incentive compensation constituted a significant portion of total compensation, ranging from 30% to 50% of base pay. Criteria for bonus awards depended on specific job responsibilities but often included the earnings level, the ability of managers to meet budgets, and overall corporate performance. There was some interest, however, in basing the incentive compensation, in part, on a comparison of the divisional return on net assets and the market-based divisional hurdle rate. The compensation plan would then reflect hurdle rates, making managers more sensitive to Marriott's financial strategy and capital market conditions. Figure A Typical Hotel Profit and Hurdle Rates 40 30 20 Profit rate (%) 10 0 -10 -20 7 8 + 9 10 Hurdle rate (%) 11 12 Source: Casewriter's estimates. Note: Profit rate for a hotel is its net present value divided by its cost. Company Background Marriott Corporation began in 1927 with J. Willard Marriott's root beer stand. Over the next 60 years, the business grew into one of the leading lodging and food service companies in the United States. Marriott's 1987 profits were $223 million on sales of $6.5 billion. See Exhibit 1 for a summary of Marriott's financial history. Marriott had three major lines of business: lodging, contract services, and restaurants. Exhibit 2 summarizes its line-of-business data. Lodging operations included 361 hotels, with more than 100,000 rooms in total. Hotels ranged from the full-service, high-quality Marriott hotels and suites to the moderately priced Fairfield Inn. Lodging generated 41% of 1987 sales and 51% of profits. Contract services provided food and services management to health care and educational institutions and corporations. It also provided airline catering and airline services through its Marriott In-Flite Services and Host International operations. Contract services generated 46% of 1987 sales and 33% of profits. Marriott's restaurants included Bob's Big Boy, Roy Rogers, and Hot Shoppes. Restaurants provided 13% of 1987 sales and 16% of profits. Financial Strategy The four key elements of Marriott's financial strategy were the following: Manage rather than own hotel assets. Invest in projects that increase shareholder value. Optimize the use of debt in the capital structure. Repurchase undervalued shares. Manage rather than own hotel assets In 1987, Marriott developed more than $1 billion worth of hotel properties, making it one of the 10 largest commercial real estate developers in the United States. With a fully integrated development process, Marriott identified markets, created development plans, designed projects, and evaluated potential profitability. After development, the company sold the hotel assets to limited partners while retaining operating control as the general partner under a long-term management contract. Management fees typically equaled 3% of revenues plus 20% of the profits before depreciation and debt service. The 3% of revenues usually covered the overhead cost of managing the hotel. Marriott's 20% of profits before depreciation and debt service often required it to stand aside until investors earned a prespecified return. Marriott also guaranteed a portion of the partnership's debt. During 1987 3 Marriott hotels and 70 Courtyard hotels were syndicated for $890 million. In total, the company operated about $7 billion worth of syndicated hotels. Invest in projects that increase shareholder value The company used discounted cash flow techniques to evaluate potential investments. The hurdle rate assigned to a specific project was based on market interest rates, project risk, and estimates of risk premiums. Cash flow forecasts incorporated standard companywide assumptions that limited discretion in cash flow estimates and instilled some consistency across projects. As one Marriott executive put it, Our projects are like a lot of similar little boxes. This similarity disciplines the pro forma analysis. There are corporate macro data on inflation, margins, project lives, terminal values, percent of sales required to remodel, and so on. Projects are audited throughout their lives to check and update these standard pro forma template assumptions. Divisional managers still have discretion over unit-specific assumptions, but they must conform to the corporate templates. Optimize the use of debt in the capital structure Marriott determined the amount of debt in its capital structure by focusing on its ability to service its debt. It used an interest coverage target instead of a target debt-to-equity ratio. In 1987, Marriott had about $2.5 billion of debt, 59% of its total capital Repurchase undervalued shares Marriott regularly calculated a "warranted equity value" for its common shares and was committed to repurchasing its stock whenever its market price fell substantially below that value. The warranted equity value was calculated by discounting the equity cash flows of the firm using the equity cost of capital for the company. It was checked by paring Marriott's stock price with that of comparable companies using price-earnings ratios for each business and by valuing each business under alternative ownership structures, such as a leveraged buyout. Marriott had more confidence in its measure of warranted value than in the day-to-day market price of its stock. A gap between warranted value and market price, therefore, usually triggered repurchases instead of a revision in the warranted value by, for example, revising the hurdle rate. Furthermore, the company believed that repurchases of shares below warranted equity value were a better use of its cash flow and debt capacity than acquisitions or owning real estate. In 1987, Marriott repurchased 13.6 million shares of its common stock for $429 million. Cost of Capital Marriott measured the opportunity cost of capital for investments of similar risk using the weighted average cost of capital (WACC): WACC (1 t)(D/V) + PE(EIV) where D and E are the market values of the debt and equity, respectively, p is the pre-tax cost of debt, Te is the after-tax cost of equity, V is the value of the firm (V = D + E), and t is the corporate tax rate. Marriott used this approach to determine the cost of capital for the corporation as a whole and for each division. To determine the opportunity cost of capital, Marriott required three inputs: debt capacity, debt cost, and equity cost consistent with the amount of debt. The cost of capital varied across the three divisions because all three of the cost-of-capital inputs could differ for each division. The cost-of-capital for each division was updated annually. Debt Capacity and the Cost of Debt Marriott applied its coverage-based financing policy to each of its divisions. It also determined for each division the fraction of debt that should be floating-rate debt based on the sensitivity of the division's cash flows to interest rate changes. The interest rate on floating-rate debt changed as interest rates changed. If cash flows increased as the interest rate increased, using floating-rate debt expanded debt capacity. In April 1988, Marriott's unsecured debt was A-rated. As a high-quality corporate risk, Marriott could expect to pay a spread above the current government bond rates. It based the debt cost for each division on an estimate of the division's debt cost as an independent company. The spread between the debt rate and the government bond rate varied by division because of differences in risk. Table A provides the market value-target leverage ratios, the fraction of the debt at floating rate, the fraction at fixed rate, and the credit spread for Marriott as a whole and for each division. The credit spread was the debt rate premium above the government rate required to induce investors to lend money to Marriott. Because lodging assets, like hotels, had long useful lives, Marriott used the cost of long-term debt for its lodging cost-of-capital calculations. It used shorterterm debt as the cost of debt for its restaurant and contract services divisions because those assets had shorter useful lives. Table A Market Value-Target Leverage Ratios and Credit Spreads for Marriott and Its Divisions Debt Percentage in Capital Fraction of Debt at Floating Fraction of Debt at Fixed Debt Rate Premium above Government Marriott 60% 40% 60% 1.30% Lodging Contract services Restaurants 74 40 42 50 40 25 50 60 75 1.10 1.40 1.80 Table B lists the interest rates on fixed-rate U.S. government securities in April 1988. Table B U.S. Government Interest Rates, April 1988 Maturity Rate 30-year 10-year 8.95% 8.72 Maturity 1-year Rate 6.90 Cost of Equity Marriott recognized that meeting its financial strategy of embarking only on projects that increased shareholder value meant that it had to use its shareholders' measure of equity costs. Marriott used the Capital Asset Pricing Model (CAPM) to estimate the cost of equity. The CAPM, originally developed by John Lintner and William Sharpe in the early 1960s, had gained wide acceptance among financial professionals. According to the CAPM, the cost of equity or, equivalently, the expected return for equity was determined as Expected return = R = Risk-free rate + b[Risk premium] where the risk premium is the difference between the expected return on the market portfolio and the risk-free rate. The key insight in the CAPM was that risk should be measured relative to a fully diversified portfolio of risky assets such as common stocks. The simple adage, don't put all your eggs in one basket, dictated that investors could minimize their risks by holding assets in fully diversified portfolios. An asset's risk was not measured as an individual risk. Instead, the asset's contribution to the risk of a fully diversified or market portfolio was what mattered. This risk, usually called systematic risk, was measured by the beta coefficient (B). Betas could be calculated from historical data on common stock returns using simple linear regression analysis. Marriott's beta, calculated using daily stock returns during 1986 and 1987, was .97 Two problems limited the use of the historical estimates of beta in calculating the hurdle rates for projects. First, corporations generally had multiple lines of business. A company's beta, therefore, was a weighted average of the betas of its different lines of business. Second, leverage affected beta. Adding debt to a firm increased its equity beta even if the riskiness of the firm's assets remained unchanged, because the safest cash flows went to the debt holders. As debt increased, the cash flows remaining for stockholders became more risky. The historical beta of a firm, therefore, had to be interpreted and adjusted before it could be used as a project's beta, unless the project had the same risk and the same leverage as the firm overall. Exhibit 3 contains the beta, leverage, and other related information for Marriott and comparable companies in the lodging and restaurant businesses. To select the appropriate risk premium to use in the hurdle rate calculations, Mr. Cohrs examined a variety of data on the stock and bond markets. Exhibit 4 provides historical information on the holding-period returns on government and corporate bonds and the S&P 500 Composite Index of common stocks. Holding-period returns are the returns realized by the security holder, including any cash payment (e.g., dividends for common stocks, coupons for bonds) received by the holder plus any capital gain or loss on the security. As examples, the 5.23% holding-period return for the S&P 500 Composite Index of common stocks in 1987 is the sum of the dividend yield of 3.20% and the capital gain of 2.03%. The -2.69% holding-period return for the index of long-term U.S. government bonds in 1987 is the sum of the coupon yield of 7.96% and a capital gain of -10.65%.1 1 Cash payments are assumed to be invested in the respective securities monthly. Exhibit 5 provides statistics on the spread between the S&P 500 Composite returns and the holding-period returns on Treasury bills, U.S. government bonds, and high-grade, long-term corporate bonds. Mr. Cohrs was concerned about the correct time interval to measure these averages, especially given the high returns and volatility of the bond markets shown in Exhibits 4 and 5. He was concerned also about which measure of expected returns should be used. Exhibits 4 and 5 present two different measures of average annual return, the arithmetic and the geometric. The arithmetic average return is the sum of the annual returns over the time period divided by the number of years in the time interval. The geometric average return is the compound average growth rate over the time interval. For example, if the return for a security were - 10% in period I and 30% in period 2, the two averages would be Arithmetic average : (-10% + 30%)/2 = 10.0%) Geometric average: (.9)(1.3) - 1 = 8.2% Exhibit 1 Financial History, 1978-1987 (millions of dollars except per share data) 1978 1979 1980 1981 1982 1983 1984 1985 1986 1987 $1,174.1 $1,426.0 $1,633.9 $1,905.7 $2,458.9 $2,950.5 $3,524.9 $4,241.7 $5,266.5 $6,522.2 Summary of Operations Sales Earnings before interest expense and income taxes Interest expense Income before income taxes Income taxes Income from continuing operationsa Net income Funds from continuing operationsb 107.1 23.7 83.5 35.4 48.1 54.3 101.2 133.5 27.8 105.6 43.8 61.8 71.0 117.5 150.3 46.8 103.5 40.6 62.9 72.0 173.3 52.0 121.3 45.2 76.1 86.1 160.8 205.5 71.8 133.7 50.2 83.5 94.3 203.6 247.9 62.8 185.1 76.7 108.4 115.2 272.7 297.7 61.6 236.1 100.8 135.3 139.8 322.5 371.3 75.6 295.7 128.3 167.4 167.4 372.3 420.5 60.3 360.2 168.5 191.7 191.7 430.3 489.4 90.5 398.9 175.9 223.0 223.0 472.8 125.8 Capitalization and Returns Total assets Total capital Long-term debt Shareholders' equity Long-term debt/total capital $1,000.3 826.9 309.9 418.7 37.5% $1,080.4 891.9 365.3 413.5 41.0% $1,214.3 977.7 536.6 311.5 54.9% $1,454.9 1,167.5 607.7 421.7 52.1% $2,062.6 1,634.5 889.3 516.0 54.4% $2,501.4 2,007.5 1,071.6 628.2 53.4% $2,904.7 2,330.7 1,115.3 675.6 47.9% $3,663.8 2,861.4 1,192.3 848.5 41.7% $4,579.3 3,561.8 1,662.8 991.0 46.7% $5,370.5 4,247.8 2,498.8 810.8 58.8% $1.24 1.24 Per Share and Other Data Earnings per share Continuing operations a Net income Cash dividends Shareholders' equity Market price (year-end) Shares outstanding (millions) Return on average shareholders' equity $.25 .29 .026 2.28 2.43 183.6 13.9% $.34 .39 .034 2.58 3.48 160.5 17.0% $.45 .52 .042 2.49 6.35 125.3 23.8% $.57 .64 .051 3.22 7.18 130.8 23.4% $.61 .69 .063 3.89 11.70 132.8 20.0% $.78 .83 .076 4.67 14.25 134.4 20.0% $1.00 1.04 .093 5.25 14.70 128.8 22.1% .113 6.48 21.56 131.0 22.1% $1.40 1.40 . 136 7.59 29.75 130.6 20.6% $1.67 1.67 .17 6.82 30.00 118.8 22.2% Source: Company reports aThe company's theme park operations were discontinued in 1984. bFunds provided from continuing operations consist of income from continuing operations plus depreciation, deferred income taxes, and other items not currently affecting working capital. Total capital represents total assets less current liabilities. Exhibit 2 Financial Summary by Business Segment, 1982-1987 (millions of dollars) 1982 1983 1984 1985 1986 1987 Lodging Sales Operating profit Identifiable assets Depreciation Capital expenditures $1,091.7 132.6 909.7 22.7 371.5 $1,320.5 139.7 1,264.6 27.4 377.2 $1,640.8 161.2 1,786.3 31.3 366.4 $1,898.4 185.8 2,108.9 32.4 808.3 $2,233.1 215.7 2,23 37.1 966.6 $2,673.3 263.9 2,777.4 43.9 1,241.9 Contract Services Sales Operating profit Identifiable assets Depreciation Capital expenditures 819.8 51.0 373.3 22.9 127.7 950.6 71.1 391.6 26.1 43.8 1,111.3 86.8 403.9 28.9 55.6 1,586.3 118.6 624.4 40.2 125.9 2,236.1 154.9 1,070.2 61.1 448.7 2,969.0 170.6 1,237.7 75.3 112.7 Restaurants Sales Operating profit Identifiable assets Depreciation Capital expenditures 547.4 48.5 452.2 25.1 199.6 679.4 63.8 483.0 31.8 65.0 707.0 79.7 496.7 35.5 72.3 757.0 78.2 582.6 34.8 128.4 797.3 79.1 562.3 38.1 64.0 879.9 82.4 567.6 42.1 79.6 Source: Company reports Exhibit 3 Information on Comparable Hotel and Restaurant Companies Arithmetic Average Return a Geometric Average Return a Equity Beta 1987 Revenues ($ billions) Market Leverage Company and Nature of Business 22.4% 21.4% .97 41% $6.52 Marriott Corporation (Owns, operates, manages hotels, restaurants, airline and institutional food services) 13.3 12.9 .88 14 .77 Hilton Hotels Corporation (Owns, manages, licenses hotels; operates casinos) 28.8 26.9 1.46 79 1.66 Holiday Corporation (Owns, manages, licenses hotels, restaurants; operates casinos) -6.4 -8.6 .38 69 .17 La Quinta Motor Inns (Owns, operates, licenses motor inns) 11.7 2.8 .95 65 .75 Ramada Inns (Owns, operates hotels, restaurants) -3.2 -7.3 .75 4 .39 Church's Fried Chicken (Owns, franchises restaurants, gaming businesses) 20.3 17.7 .60 10 .57 Collins Foods International (Operates Kentucky Fried Chicken franchise, moderately priced restaurants) 56.9 49.7 .13 6 .14 Frisch's Restaurants (Operates, franchises restaurants) 15.1 12.8 .64 1 .23 Luby's Cafeterias (Operates cafeterias) 22.5 21.3 1.00 23 4.89 McDonald's (Operates, franchises, services restaurants) 4.6 -1.4 1.08 21 1.05 Wendy's International (Operates, franchises, services restaurants) Source: Casewriter's estimates. aCalculated over period 1983-1987. bEstimated by ordinary least-squares regression using daily data over 1986-1987 period. CBook value of debt divided by the sum of the book value of debt plus the market value of equity. Exhibit 4 Annual Holding-Period Returns for Selected Securities and Market Indexes, 1926-1987 Arithmetic Average Geometric Average Standard Deviation Short-Term Treasury Bill Returns 1926-1987 3.54% 3.48% .94% 1926-1950 1951-1975 1976-1980 1981-1985 1986 1987 1.01 3.67 7.80 10.32 6.16 5.46 1.00 3.66 7.77 10.30 6.16 5.46 .40 .56 .83 .75 .19 .22 Long-Term U.S. Government Bond Returns 1926-1987 4.58% 4.27% 7.58% 4.14 2.39 1926-1950 1951-1975 1976-1980 1981-1985 1986 1987 1.95 17.85 24.44 -2.69 4.04 2.22 1.69 16.82 24.44 -2.69 4.17 6.45 11.15 14.26 17.30 10.28 Long-Term, High-Grade Corporate Bond Returns 1926-1987 5.24% 4.93% 6.97% 1926-1950 1951-1975 1976-1980 1981-1985 1986 1987 4.82 3.05 2.70 18.96 19.85 -.27 4.76 2.86 2.39 17.83 19.85 -.27 3.45 6.04 10.87 14.17 8.19 9.64 Standard & Poor's 500 Composite Stock Index Returns 1926-1987 12.01% 9.90% 20.55% 1926-1950 1951-1975 1976-1980 1981-1985 1986 1987 10.90 11.87 14.81 15.49 18.47 5.23 7.68 10.26 13.95 14.71 18.47 5.23 27.18 13.57 14.60 13.92 17.94 30.50 Source: Casewriter's estimates based on data from the University of Chicago's Center for Research in Security Prices. Exhibit 5 Spreads between S&P 500 Composite Returns and Bond Rates, 1926-1987 Arithmetic Average Geometric Average Standard Deviation Spread between S&P 500 Composite Returns and Short-Term Treasury Bill Returns 1926-1987 8.47% 6.42% 20.60% 1926-1950 1951-1975 1976-1980 1981-1985 1986 1987 9.89 8.20 7.01 5.17 21.31 - 23 6.68 6.60 6.18 4.41 12.31 -.23 27.18 13.71 14.60 14.15 17.92 30.61 Spread between S&P 500 Composite Returns and Long-Term U.S. Government Bond Returns 1926-1987 7.43% 5.63% 20.78% 1926-1950 1951-1975 1976-1980 1981-1985 1986 1987 6.76 9.48 12.86 -2.36 -5.97 7.92 3.64 8.04 12.26 -2.11 -5.97 7.92 26.94 14.35 15.58 13.70 14.76 35.35 Spread between S&P 500 Composite Returns and Long-Term, High-Grade Corporate Bond Returns 1926-1987 6.77% 4.97% 20.31% 1926-1950 1951-1975 1976-1980 1981-1985 1986 1987 6.08 8.82 12.11 -3.47 -1.38 5.50 2.92 7.40 11.56 -3.12 -1.38 5.50 26.70 13.15 15.84 13.59 14.72 34.06 Source: Casewriter's estimates based on data from the University of Chicago's Center for Research in Security Prices