Question
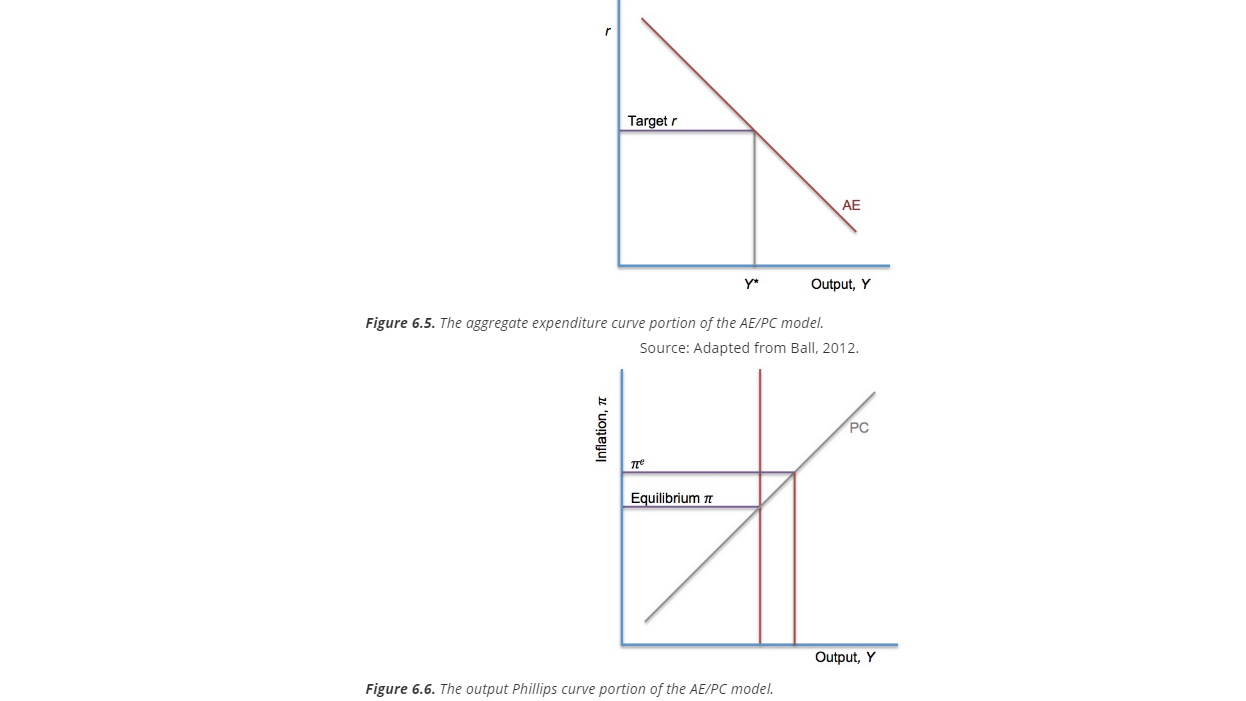
Question: Illustrate a permanent decrease in government spending (let's say infrastructure spending freeze) implemented in 2022. For simplicity, assume there are no time lags. a).
Question: Illustrate a permanent decrease in government spending (let's say infrastructure spending freeze) implemented in 2022. For simplicity, assume there are no time lags.
a). : To illustrate that shock, use AE/PC Model (carefully labeled!!) without time lags (use the AE and PC graphs similarly to the one attached below, place PC graph below AE graph). For your analysis, choose as a starting point (marked A) an economy operating at potential GDP (Y=Y*) and at its inflation target (? = ?^T). Also, show point B where the economy is situated after the shock but prior to any central bank policy response. There should be A and B on BOTH the upper (AE graph) and lower (PC graph) graphs. If points A and B are the same point, then just mark that point with both A and B. Mark initial curves with the superscript 1, like AE1 and PC1 , and every subsequent shift with a higher number, like the second shift would be AE2 and PC2 , and the third shift (if necessarily) would be AE3 and PC3 and so on.
b): Now, illustrate that counter-cyclical monetary policy has been implemented by the central bank. Again, use AE/PC Model (new set of graphs!). Now your initial point is point B, mark the response as point C. There should be a points B and C on both the upper graph and the lower graph, even if they are in the same location. You can stop your analysis when the economy is stabilized (Y=Y* again).

Step by Step Solution
There are 3 Steps involved in it
Step: 1

Get Instant Access to Expert-Tailored Solutions
See step-by-step solutions with expert insights and AI powered tools for academic success
Step: 2

Step: 3

Ace Your Homework with AI
Get the answers you need in no time with our AI-driven, step-by-step assistance
Get Started


