Question in the first page.
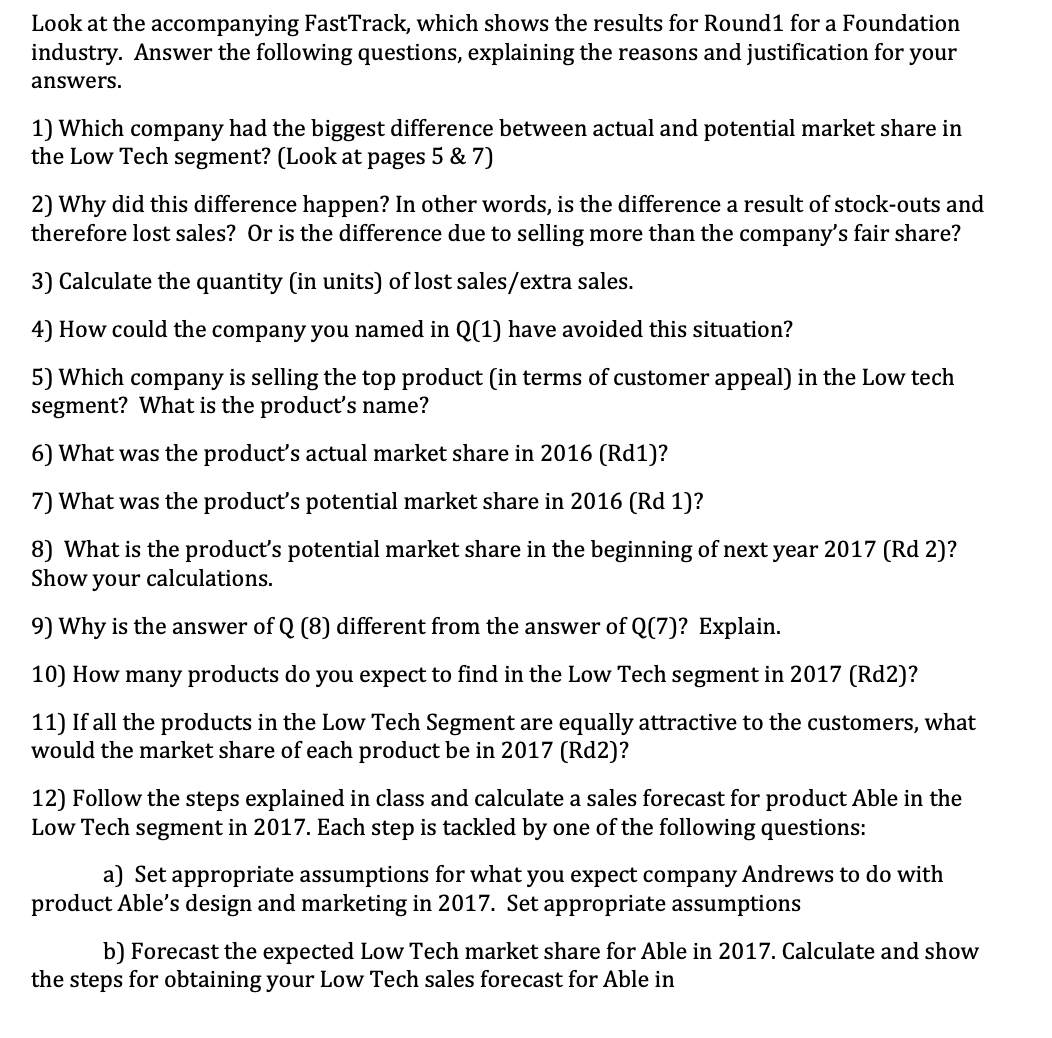
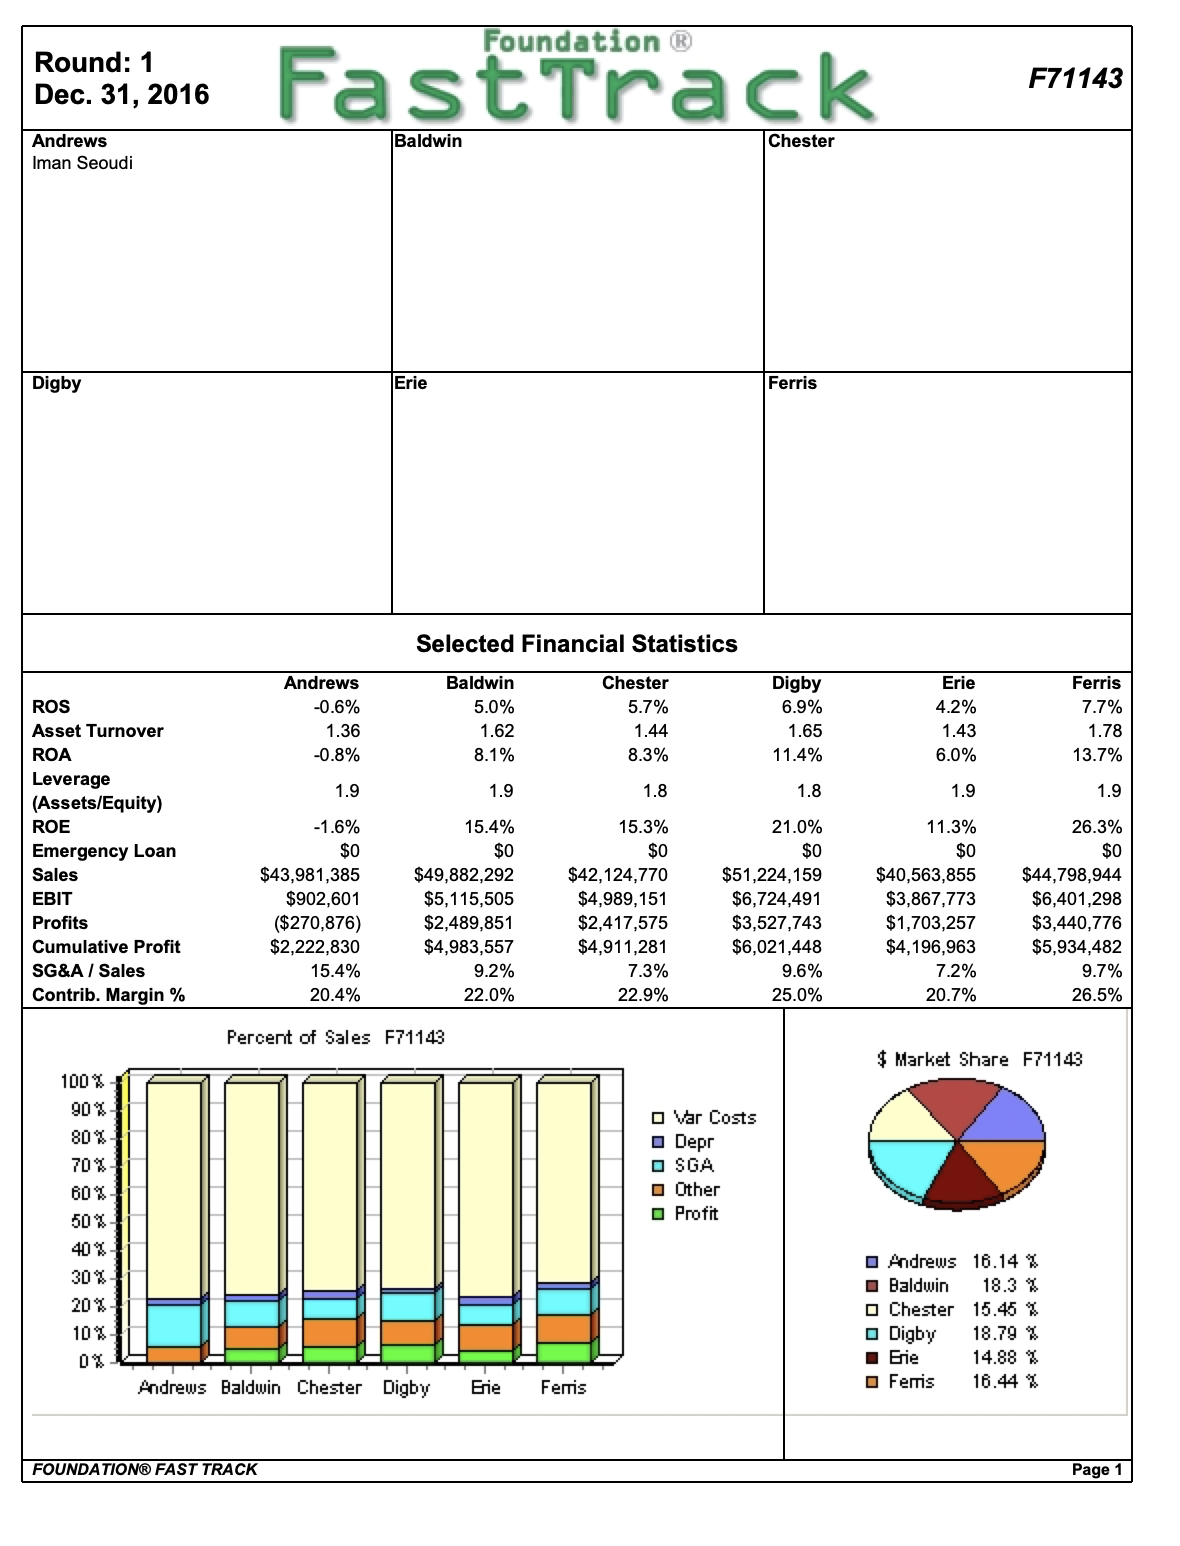
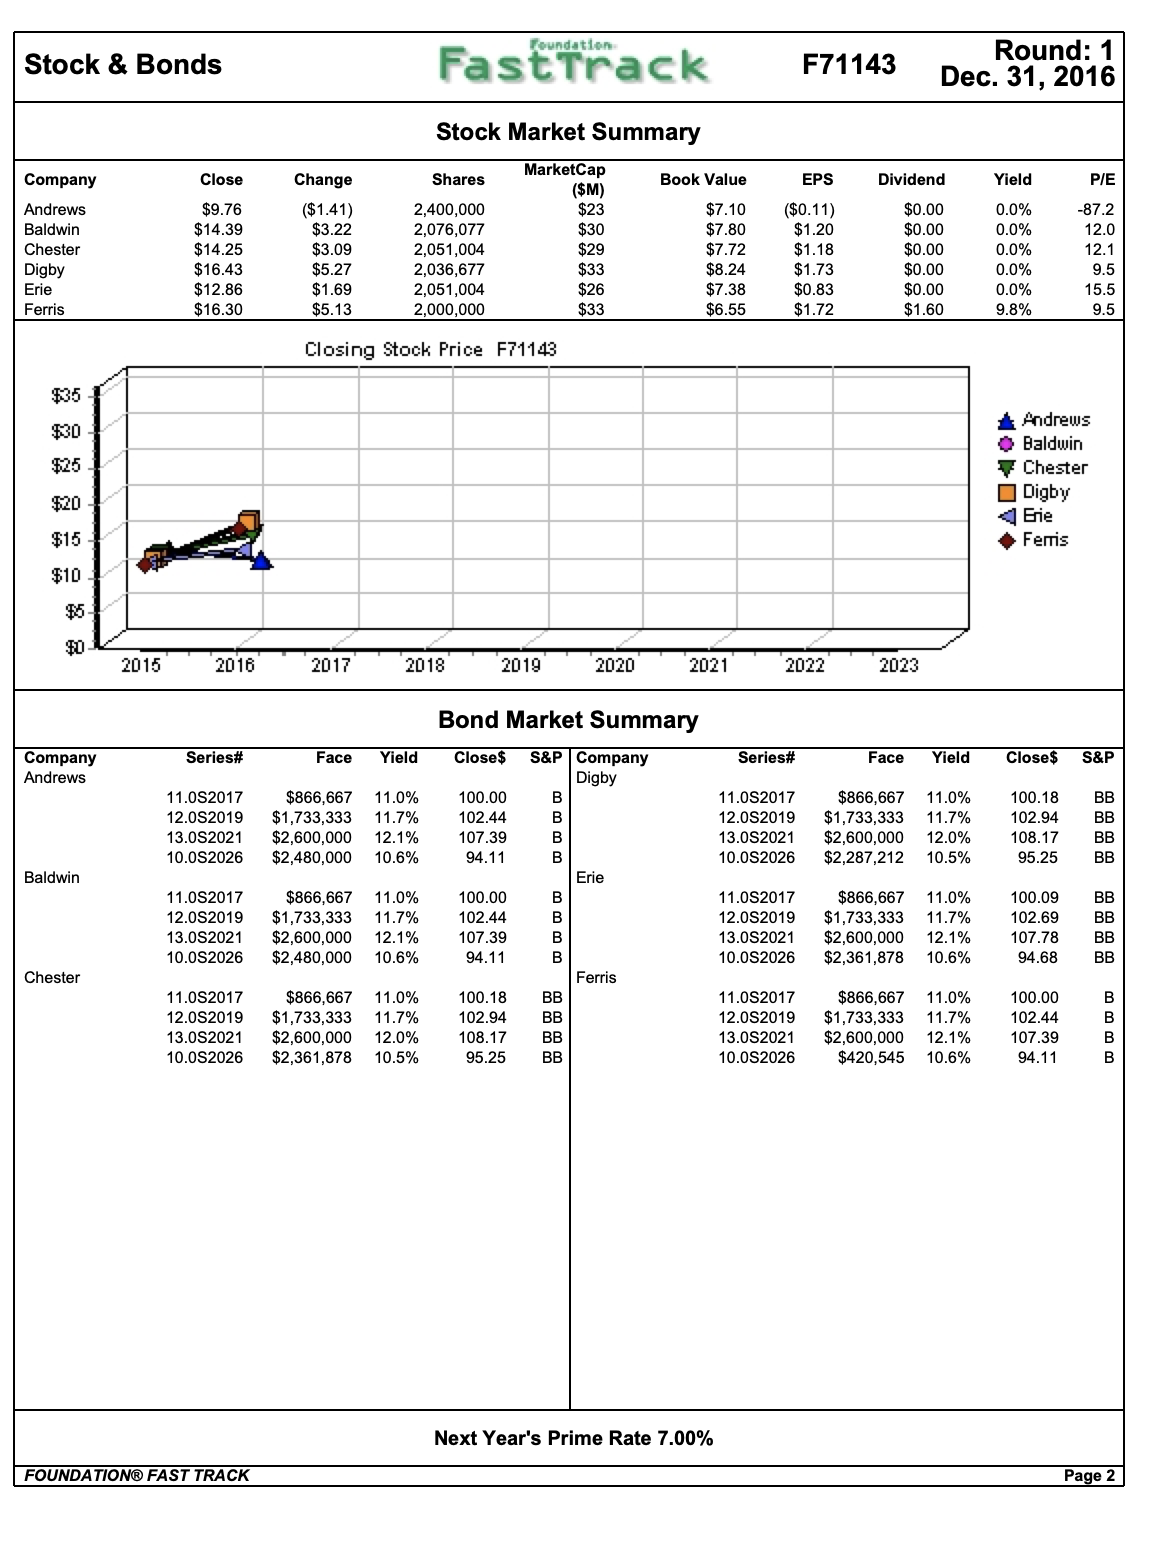
Look at the accompanying FastTrack, which shows the results for Roundl for a Foundation industry. Answer the following questions, explaining the reasons and justification for your answers. 1) Which company had the biggest difference between actual and potential market share in the Low Tech segment? (Look at pages 5 & 7) 2) Why did this difference happen? In other words, is the difference a result of stock-outs and therefore lost sales? Or is the difference due to selling more than the company's fair share? 3) Calculate the quantity [in units] of lost sales / extra sales. 4) How could the company you named in Q[1) have avoided this situation? 5) Which company is selling the top product [in terms of customer appeal) in the Low tech segment? What is the product's name? 6) What was the product's actual market share in 2016 [Rdl]? 7) What was the product's potential market share in 2016 [Rd 1)? 8) What is the product's potential market share in the beginning of next year 2017 [Rd 2)? Show your calculations. 9) Why is the answer of Q (8] different from the answer of Q(7)? Explain. 10) How many products do you expect to nd in the Low Tech segment in 2017 [Rd2)? 11) If all the products in the Low Tech Segment are equally attractive to the customers, what would the market share of each product be in 2017 [Rd2)? 12) Follow the steps explained in class and calculate a sales forecast for product Able in the Low Tech segment in 2017. Each step is tackled by one of the following questions: a) Set appropriate assumptions for what you expect company Andrews to do with product Able's design and marketing in 2017. Set appropriate assumptions b) Forecast the expected Low Tech market share for Able in 2017. Calculate and show the steps for obtaining your Low Tech sales forecast for Able in Round: 1 Foundation R Dec. 31, 2016 FastTrack F71143 Andrews Baldwin Chester Iman Seoudi Digby IErie Ferris Selected Financial Statistics Andrews Baldwin Chester Digby Erie Ferris ROS 0.6% 5.0% 5.7% 6.9% 4.2% 7.7% Asset Turnover 1.36 1.62 1.44 1.65 1.43 1.78 ROA -0.8% 8.1% 8.3% 11.4% 6.0% 13.7% Leverage 1.9 1.9 1.8 1.8 1.9 1.9 (Assets/Equity) ROE -1.6% 15.4% 15.3% 21.0% 11.3% 26.3% Emergency Loan $0 $0 $0 $0 $0 Sales $43,981,385 $49,882,292 $42, 124,770 $51,224, 159 $40,563,855 $44,798,944 EBIT $902,601 $5, 115,505 $4,989, 151 $6,724,491 $3,867,773 $6,401,298 Profits ($270,876) $2,489,851 $2,417,575 $3,527,743 $1,703,257 $3,440,776 Cumulative Profit $2,222,830 $4,983,557 11,281 $6,021,44 $4, 196,963 $5,934,482 SG&A / Sales 15.4% 9.2% 7.3% 9.6% 7.2% 9.7% Contribargin % 20.4% 22.0% 22.9% 25.0% 20.7% 26.5% Percent of Sales F71143 $ Market Share F71143 100 % 90% O Var Costs 80 % Depr 70 %- O SGA 60 %- o Other 50% Profit 40 % O Andrews 16.14 % 30 % - Baldwin 18.3 % 20 % - Chester 15.45 % 10% 0 Digby 18.79 % 0% J Erie 14.88 % Andrews Baldwin Chester Digby Erie Ferris Fems 16.44 % FOUNDATION FAST TRACK Page 1Stock & Bonds FastTrack F71143 Round: 1 Dec. 31, 2016 Stock Market Summary Company Close Change Shares MarketCap PIE $M) Book Value EPS Dividend Yield Andrews $9.76 ($1.41) 2,400,000 $23 $7.10 ($0.11) $0.00 0.0% -87.2 Baldwin $14.39 $3.22 2,076,077 $30 $7.80 $1.20 $0.00 0.0% 12.0 Chester $14.25 $3.09 2,051,004 $29 $7.72 $1.18 $0.00 0.0% 12.1 Digby $16.43 $5.27 2,036,677 $33 $8.24 $1.73 $0.00 0.0% 9.5 Erie $12.86 $1.69 2,051,004 $26 $7.38 $0.83 $0.00 0.0% 15.5 Ferris $16.30 $5.13 2,000,000 $33 $6.55 $1.72 $1.60 9.8% 9.5 Closing Stock Price F71143 $35 & Andrews $30 Baldwin $25 7 Chester Digby $20 Erie $15 . Ferris $10 $5- 2015 2016 2017 2018 2019 2020 2021 2022 2023 Bond Market Summary Company Series# Face Yield Close$ S&P | Company Series# Face Yield Close$ S&P Andrews Digby 11.0S2017 $866,667 11.0% 100.00 11.0S2017 $866,667 11.0% 100.18 12.082019 $1,733,333 11.7% 102.44 12.082019 $1,733,333 11.7% 102.94 13.0S2021 $2,600,000 12.1% 107.39 13.0S2021 $2,600,000 12.0% 108.17 BB 10.0S2026 $2,480,000 10.6% 94.11 10.0S2026 $2,287,212 10.5% 95.25 BB Baldwin Erie 11.082017 $866,667 11.0% 100.00 11.0S2017 $866,667 11.0% 100.09 BB 12.0S2019 $1,733,333 11.7% 102.44 12.0S2019 $1,733,333 11.7% 102.69 BB 13.0S2021 $2,600,000 12.1% 107.39 13.0S2021 $2,600,000 12.1% 107.78 BB 10.052026 $2,480,000 10.6% 94.11 10.0S2026 $2,361,878 10.6% 94.68 BB Chester Ferris 11.0S2017 $866,667 11.0% 100.18 BB 11.0S2017 $866,667 11.0% 100.00 12.052019 $1,733,333 11.7% 102.94 BB 12.052019 $1,733,333 11.7% 102.44 13.0S2021 $2,600,000 12.0% 108.17 BB 13.0S2021 $2,600,000 12.1% 107.39 10.0S2026 $2,361,878 10.5% 95.25 BB 10.0S2026 $420,545 10.6% 94.11 Next Year's Prime Rate 7.00% FOUNDATION@ FAST TRACK Page 2Financial Summary FastTrack F71143 Round: 1 Dec. 31, 2016 Cash Flow Statement Survey Andrews Baldwin Chester Digby Erie Ferris CashFlows from operating activities Net Income(Loss ($271) $2,490 $2,418 $3,528 $1,703 $3,441 Adjustment for non-cash items: Depreciation $960 $1,064 $1,426 $1,020 $1,133 Extraordinary gains/losses/writeoffs $0 $0 $0 $0 $0 $0 Changes in current assets and liablilities Acounts payable ($170) $300 $222 ($161) Inventory $2.352 $307 $166 $801 ($144 Accounts Receivable ($3,876) $19 Net cash from operations $1,005) $3,415 $3,244 $4,714 $2,182 $3,941 Cash flows from investing activities Plant improvements(net) ($6,920) ($6,925) ($6,995) ($6,500) ($6,995) ($2,600) Cash flows from financing activities Dividends paid $0 $0 $0 $0 $0 ($3, 195) Sales of common stock $4,467 $570 $410 Purchase of common stock $0 $0 Cash from long term debt issued $2,480 $2,480 $2,362 $2,287 $2,362 Early retirement of long term debt $0 $0 Retirement of current debt $0 $0 $0 Cash from current debt borrowing $5,000 $3,691 $3,679 $3,679 $3.679 $3,679 Cash from emergency loan $0 $0 $0 $0 Net cash from financing activities $11,947 $6,610 $6,376 $6,610 $905 Net change in cash position $4,022 $3,510 $2,859 $4,590 $1,798 $2,246 Balance Sheet Survey Andrews Baldwin Chester Erie Ferris Cash $9,624 $9, 112 $8,461 $10, 191 $7,399 $7,847 Accounts Receivable $7,230 $4, 100 $3,462 $4,210 $3.334 $3,682 Inventory $0 $2, 186 $1,551 $2,483 $2,496 Total Current Assets $16,854 $15,257 $14, 109 $15,953 $13,216 $14,025 Plant and equipment $21,320 $21,325 $20,900 $21,395 $17,000 Accumulated Depreciation ($5,760) ($6,226) ($5,820) ($5,933) Total Fixed Assets $15,560 $15,461 $15, 168 $15,080 $15, 168 $11,067 Total Assets $32,414 $30,718 $29,278 $31,033 $25,092 Account Payable $2,684 $3,154 $2, 196 $3,076 $2,017 $2,693 CurrentDebt $5,000 $3,691 $3,679 $3,679 $3,679 $3,679 Long Term Debt $7,680 $7,562 $7,487 $7,562 $5,621 Total Liabilities $15,364 $14,525 $13,437 $14,242 Common Stock $6,790 $3,173 $2,893 $2,733 $2,893 $2,323 Retained Earnings $10,260 $13,020 $12,948 $14,058 $12,234 $10,777 Total Equity $17,050 $16, 193 $15,841 $16,791 $15,127 Total Liabilities & Owners" Equity $32,414 $30,718 $29,278 $31,033 $28,385 Income Statement Survey Andrews Baldwin Chester Erie Ferris Sales $43,981 $49,882 $42, 125 $51,224 Variable Costs(Labor, Material, Carry) $35,005 $38,922 $32,48 $38,409 $32, 184 $32,917 $960 $1,064 $1,426 $1,020 $1,426 $1,133 SGA(R&D,Promo, Sales,Admin) $6,767 $4,614 $3,073 $4,936 $2,940 $4,326 Other(Fees, Writeoffs, TQM, Bonuses) $347 $166 $147 $21 EBIT $903 $5, 1 16 $4,989 $6,724 $3,86 $6,401 Interest(Short term, Long term) $1,319 $1,207 $1,194 $1,186 $1, 194 $1,000 Taxes ($146) $1,368 $1,328 $1,938 $936 $1,891 Profit Sharing $0 $51 $49 $72 $35 $70 Net Profit ($271) $2,490 $2,418 $3,528 $1,703 $3,441 FOUNDATION@ FAST TRACK Page 3FastTrack F71143 Round: 1 Production Analysis Dec. 31, 2016 Production V's. Capacity F71143 Andrews Baldwin Chester Digby Erie Ferris D 100 200 300 400 500 600 700 800 900 1,000 1,100 1,200 1,300 1,400 O Capacity O Production 2nd shift Auto & mation Capacity Unit Age Pfmn Size Material Labor Contr Over- Next Next Plant Inven Round Utiliz. Primary Units tory Revision Date Dec.31 Coord Coord Price Cost Cost Marg time Round Segment Sold 64 13.6 $32.00 14.13 $10.60 20% 33% 3.0 800 161% Name 1,374 0 1/29/2016 4.1 19000 0% 0% 1.0 150 0% Able Low 0 7/31/2017 0.0 0 0.0 0.0 $0.00 $0.00 $0.00 2.0 280 0% Awsom 0 2/27/2017 00 0.0 0.0 $0.0 $0.00 $0.00 0% 0% 0% Away 0 0.0 0.0 0.0 $0.00 $0.00 $0.00 0% 0% 10 150 Apple 8/24/2017 13.8 $33.40 14.16 $10.95 22% 38% 3.2 849 186% Baker Low 1.493 3/1 1/2016 2.5 1980 5/13/2017 10 00 0.0 $0.00 $0.00 $0.00 0% 0 0 30 298 0% Bold 0 2.3 18250 5.7 14.2 $32.60 $12.50 $10.56 23% 63% 1.8 849 162% Cake Low 1,292 88 7/22/2016 20600 13.4 $35.0 $14.52 $10.88 5% 81% 3.0 850 179%% 3/15/2016 2.4 $0.00 25 350 0% Daze Low 1.464 59 0 5/9/2017 0.0 0 00 0.0 $0.00 Dabble 14.4 $31.65 $12.40 $10.54 21% 63% 4.8 849 162% Eat Low 1.282 100 7/27/2016 2.3 17500 6.0 35 850 155% 7 6 12.7 $36.40 $17.15 $10.50 27% 56% Fast Low 1,231 10/20/2016 2.1 21500 Page 4 FOUNDATION FAST TRACKLow Tech Segment Analysis FastTrack F71143 Round: 1 Dec. 31, 2016 Low Tech Statistics Accessibility F71143 Low Tech Total Industry Unit Demand 5,544 Actual Industry Unit Sales 5,544 Andrews - Segment % of Total Industry 68.1% Baldwin 10.0% Chester Next Year's Segment Growth Rate Low Tech Customer Buying Criteria Digby Expectations Importance Erie 1. Price $15.00 - 35.00 41% Ferris 2. Age Ideal Age = 3.0 29% 3. Reliability MTBF 14000-20000 21% 0% 20 % 40 % 60% 80 % 100% 4. Ideal Position Pfmn 5.3 Size 14.7 9% Perceptual Map for Low Tech Actual vs Potential Market Share 2016 F71143 20 Perceptual map (at end of this year) Low Tech 18 20 %- 18% 16 16% 14 14% 12% 12 Size 10% 10 8% 6 4% 2% N Andrews Baldwin Chester Digby Erie Ferris 2 6 8 10 12 14 16 18 20 O Actual Potential Performance Top Products in Low Tech Segment Units Cust Cust Dec. Market Sold to Revision Stock Pfmn Size List Age Promo Aware- Sales Access- Cust. Name Share Seg Date Out Coord Coord Price MTBF Dec.31 Budget ness Budget ibility Survey Able 18% .003 1/29/2016 YES 6.4 13.6 $32.00 19000 4.10 $1,500 73% $1,500 42% 19 Baker 18% 999 3/1 1/2016 6.4 13.8 $33.40 19800 2.45 $1,300 67% $1,300 39% 20 Daze 17% 946 3/15/2016 6.1 13.4 $35.00 20600 2.45 $1,450 72% $1,450 41% 19 Cake 17% 938 7/22/2016 5.7 14.2 $32.60 18250 2.27 $925 56% $925 34% 17 Eat 17% 927 7/27/2016 6.0 14.4 $31.65 17500 2.26 $875 54% $850 33% 16 Fast 13% 730 10/20/2016 76 12.7 $36.40 21500 2.14 $1,500 73% $1,275 36% 00 FOUNDATION@ FAST TRACK Page 5High Tech Segment Analysis FastTrack F71143 Round: 1 Dec. 31, 2016 High Tech Statistics Accessibility F71143 High Tech Total Industry Unit Demand 2,592 Actual Industry Unit Sales 2,592 Andrews Segment % of Total Industry 31.9% Baldwin Chester Next Year's Segment Growth Rate 20.0% High Tech Customer Buying Criteria Digby Expectations Importance Erie 1. Ideal Position Pfmn 8.1 Size 11.9 33% Feris 2. Age Ideal Age = 0.0 29% 3. Price $25.00 - 45.00 25% 20 % 40 % 60% 80% 100% 4. Reliability MTBF 17000-23000 13% Perceptual Map for High Tech Actual us Potential Market Share Perceptual map (at end of this year) 2016 F71143 20 High Tech 20 % 18 18% 16 16%- 14 14%- 12%- 12 Size 10% 10 3% 6% 4% 2% Andrews Baldwin Chester Digby Erie Ferris 0 2 4 6 8 10 12 14 16 18 20 O Actual Potential Performance Top Products in High Tech Segment Cust. Cust. Dec. Units Market Sold to Revision Stock Pfmn Size List Age Promo Aware- Sales Access- Cust. Share Seg Date Out Coord Coord Price MTBF Dec.31 Budget ness Budget ibility Survey Name Daze 20% 517 3/15/2016 6.1 13.4 $35.00 20600 2.45 $1,450 72% $1,450 42% 12 Fast 39% 24 19% 501 10/20/2016 7.6 12.7 $36.40 21500 2.14 $1,500 73% $1,275 Baker 19% 194 3/1 1/2016 6.4 13.8 $33.40 19800 2.45 $1,300 67% $1,300 40% 12 Able 14% 372 1/29/2016 YES 6.4 13.6 $32.00 19000 4.10 $1,500 73% $1,500 43% 11 Eat 14% 354 7/27/2016 6.0 14.4 $31.65 17500 2.26 $875 54% $850 33% Cake 14% 354 7/22/2016 5.7 14.2 $32.60 18250 2.27 $925 56% $925 34% FOUNDATION@ FAST TRACK Page 6Market Share FastTrack F71143 Round: 1 Dec. 31, 2016 Units Sold vs Demand Chart F71143 Market Share F71143 5.000- 20 % - 4,000 15% 3.000 10% 2,000 5% 1,000 Erie Low High Andrews Baldwin Chester Digby Ferris Industry Unit Sales O Total Unit Demand Low High Actual Market Share in Units Potential Market Share in Units Low High Total Low High Total Industry Unit Sales 5,544 2,592 8,136 Units Demanded 5,544 2,592 8,136 % of Market 68.1% 31.9% 100.0% % of Market 68.1% 31.9% 100.0% Able 14.3% 16.9% Able 0.4% 16.1% 19. 1% Total 18.1% 18.1% 14.3% 16.9% Tota 20.4% 16.2% 19.1% Baker 18.0% 19.1% 18.4% Baker Total 19.1% 18.4% Total 7.5% 18.7% 17.9% 8.0% 17.5% 18.7% 17.9% Cake 16.9% 13.7% 15.9% Cake 16.5% 13.4% 15.5% Total 16.9% 13.7% 15.9% Total 16.5% 13.4% 15.5% Daze 17.1% 20.0% 18.0% Daze 16.6% 19.5% 17.5% Total 17.1% 20.0% 18.0% Total 16.6% 19.5% 17.5% Eat 16.7% 13.7% 15.8% Eat 16.3% 13.4% 15.4% Total 16.7% 13.7% 15.8% Total 16.3% 13.4% 15.3% Fast 13.2% 19.3% 15.1% Fast 12.8% 18.9% 14.7% Total 13.2% 19.3% 15.1% Total 12.8% 18.9% 14.7% FOUNDATION@ FAST TRACK Page 7