Answered step by step
Verified Expert Solution
Question
1 Approved Answer
question is first two pictures, the rest are for reference. Thank You for any help! 35 You have been given two different investments: Stock X
question is first two pictures, the rest are for reference. Thank You for any help! 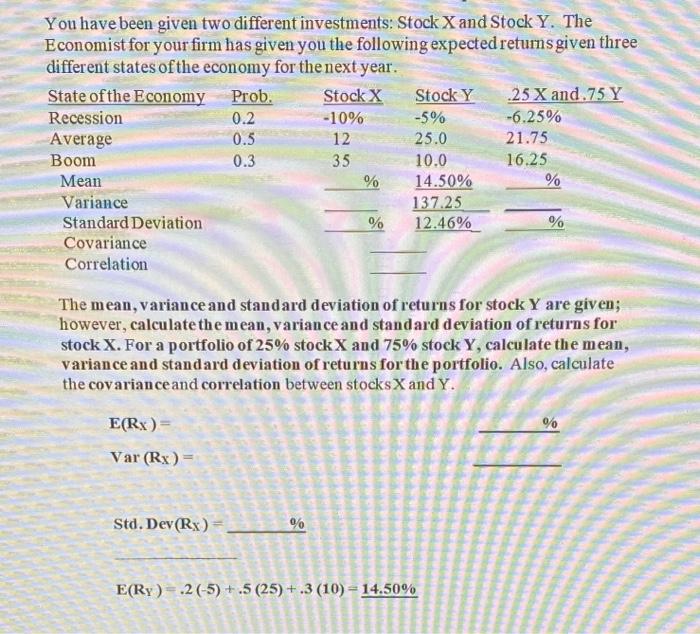
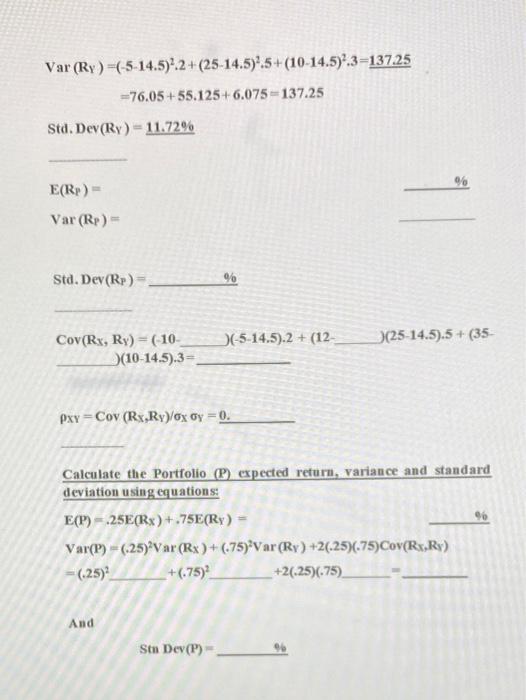
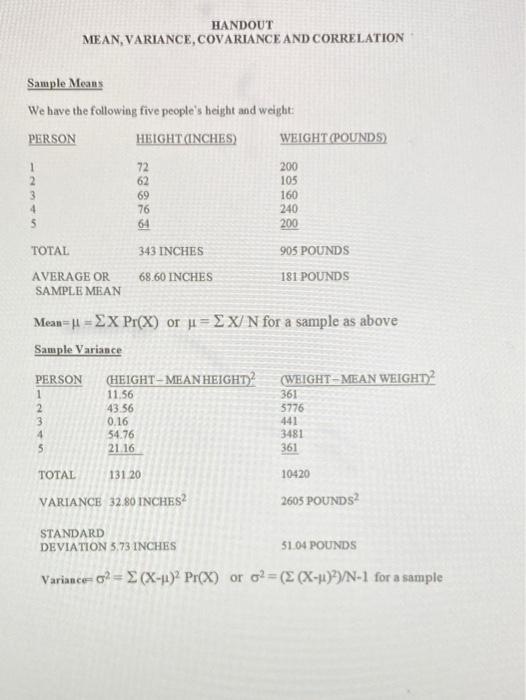
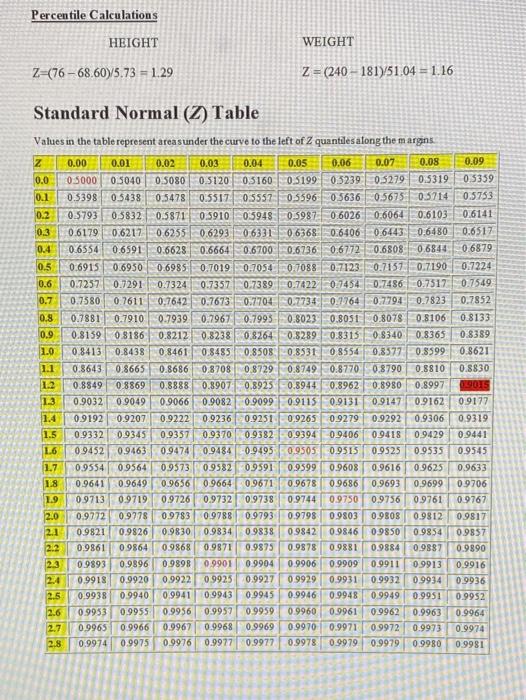
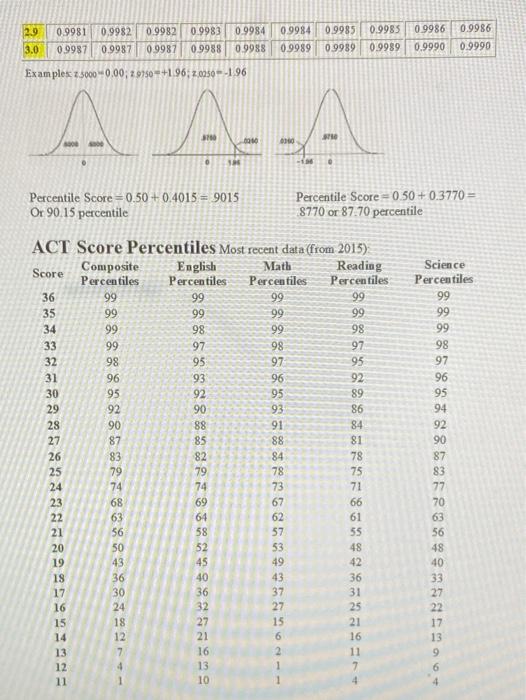
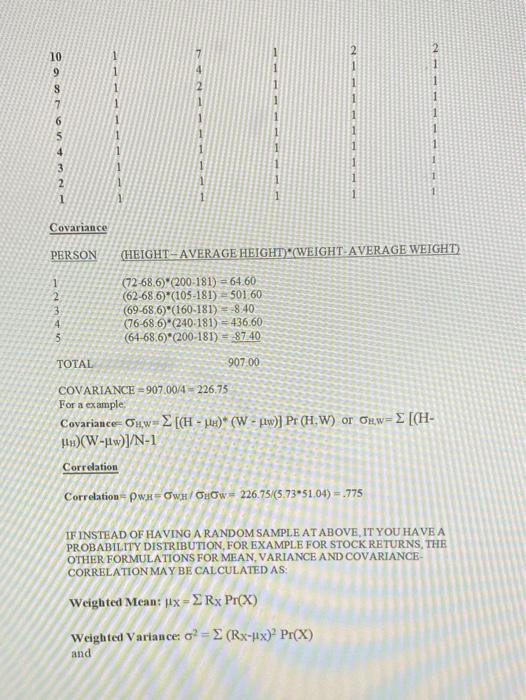
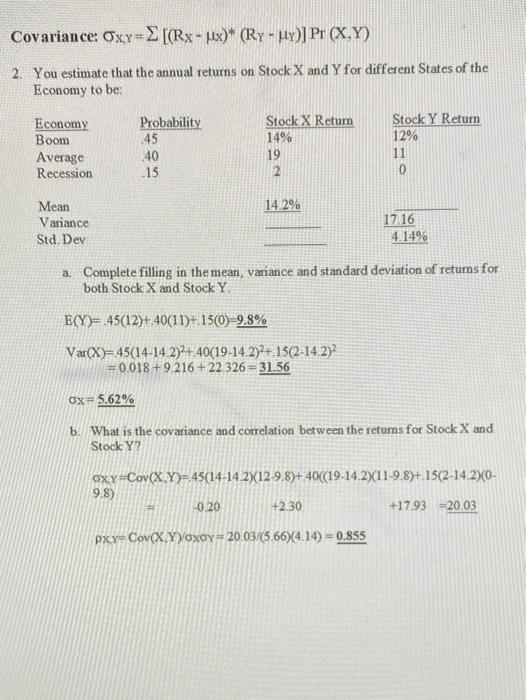
35 You have been given two different investments: Stock X and Stock Y. The Economist for your firm has given you the following expected returns given three different states of the economy for the next year. State of the Economy Prob. Stock X Stock Y .25 X and.75 Y Recession 0.2 -10% -5% -6.25% Average 0.5 12 25.0 21.75 Boom 0.3 10.0 16.25 Mean % 14.50% % Variance 137.25 Standard Deviation % 12.46% % Covariance Correlation The mean, variance and standard deviation of returns for stock Y are given; however, calculate the mean, variance and standard deviation of returns for stock X. For a portfolio of 25% stock X and 75% stock Y, calculate the mean, variance and standard deviation of returns for the portfolio. Also, calculate the covariance and correlation between stocks X and Y. E(Rx) = % Var (Rx) = Std. Dev(Rx) % E(Ry)=.2 (-5)+.5 ()+.3 (10) - 14.50% 1 + Var (Ry) (-5-14.5)2.2+(25-14.5).5+ (10-14.5)2.3=137.25 =76.05+55.125+6.075 -137.25 Std. Dev (Ry) - 11.72% % E(Rp) - Var (Rp) - Std. Dev(Rp) % (-5-14.5).2 + (12 (25-14.5).5+ (35 Cov(Ry, Ry) = (-10- (10-14.5).3= PXY = Cov (Rx.Ry)/ox oy = 0. 96 Calculate the Portfolio (P) expected return, variance and standard deviation using equations: E(P) = 25E(Rx) +.75E(RY) Var(P) - (25) Var (Rx)+(75) Var (Ry) +20.25).75)Cov(Rx,Ry) =(25) +(.75) +2.25).75) And Stn Dev(P) HANDOUT MEAN, VARIANCE, COVARIANCE AND CORRELATION Sample Means We have the following five people's height and weight PERSON HEIGHT (INCHES) WEIGHT (POUNDS) 1 2 3 4 5 72 62 69 76 200 105 160 240 200 TOTAL 343 INCHES 905 POUNDS 181 POUNDS 68.60 INCHES AVERAGE OR SAMPLE MEAN Mean=11 = EX Pr(X) or j= X/ N for a sample as above Sample Variance PERSON HEIGHT-MEAN HEIGHT)? (WEIGHT-MEAN WEIGHT? 11.56 361 1 2 3 43.56 0.16 54.76 21.16 5776 441 3481 361 5 TOTAL 10420 131 20 VARIANCE 32 80 INCHES 2605 POUNDS STANDARD DEVIATION 5.73 INCHES 51.04 POUNDS Variance 0% = E(X-11)? Pr(x) or 02 = ( (X-u)?)/N-1 for a sample Percentile Calculations HEIGHT WEIGHT 2=(76 - 68.60)/5.73 = 1.29 Z = (240 - 181751.04 = 1.16 Standard Normal (Z) Table Values in the table represent areas under the curve to the left of 2 quantiles along the margins Z 0.00 0.01 0.02 0.03 0.04 0.05 0.06 0.07 0.08 0.0 0.5000 0.5040 0.5080 0.512005160 0.5199 0.3239 0.5279 0.5319 0.1 0.5398 0.5438 0.5478 0.5517 0.5557 0.5596 05636 0.5675 0.5714 0.2 0.5793 0.5832 0.5871 0.5910 0:5948: 0.5987 0.6026 0.6064 0.6103 0.3 0.6179 0.6217 0.6255 0.6293 0.6331 06368 0.6406 0.6443 0.6480 0.4 0.6554 0.6591 0.6628 0.66640.6700 0.6736 0.6772 0.6808 0.6844 0.5 0.6915 0.6950 0.6985 0.7019 0.7054 0.7088 0.7123 0.7157 0.7190 0.6 0.7257 0.7291 0.7324 0.7357 0.7389 0.7422 0.7454 0.7486 0.7517 0.7 0.7380 0.7611 0.7642 0.7673 -0.7704.0.77340.1764 0.7794 0.7823 0.8 0.7881 0.7910 0.7939 0.7967 0.7993 0.8023 0.8051 0.8078 0.8106 0.9 0.8159 08186 0.8212 0.8238 0.8264 0.8289 0.8313 0.8340 0.8365 1.0 0.8413 0.8438 0.8461 0.8485 0.8508 0.8531 08554 0.8577 | 0.8599 1.1 0.8643 0.8665 0.8686 0.8708 0.8729 0.8749 0.8770 0.8790 0.8810 1.2 0.8849 0.8869 0.8888 0.8907 0.8925 0.8944 0.8962 0.8980 0.8997 1.3 0.9032 0.9049 0.9066 0.9082 0.9099 0.9115 0.9131 0.9147 0.9162 1.4 0.9192 0.9207 0.9222 0.9236 0.9251 0.9265 0.9279 0.9292 0.9306 1.5 0.9332 0.9345 0.9357 0.9370 0.9382 0.9394 0.9406 0.9418 0.9429 1.6 0.9452 0.9463 0.9474 0.9484 -0.9495 0.9505 0.9515 0.9525 0.9535 1.7 0.9554 0.9564 0.9573 0.9582 0.9591 0.9599 0.9608 0.9616 0.9625 1.8 0.9641 0.9649 0.9656 0.9664 0.9671 0.9678 0.9686 0.9693 0.9699 1.9 09713 0.9719 0.9726 0.9732 0.9738 0.9744 0.9750 0.9756 0.9761 2.0 0.9772 0.9778 0.9783 0.9788 0.9793 0.9798 0.9803 0.9808 0.9812 2.1 0.9821 0.9826 0.9830 0.9834 0.9838 0.9842 0.9846 09850 0.9854 2.2 0.9861 09864 0.9868 0.9871 0.9875 0.9878 0.9881 0.9884 0.9887 0.9893 0.9896 09898 0.9901 0.9904 0.9906 0.9909 0.9911 0.9913 0.9918 0.9920 0.9922 0.9925 0.9927 0.9929 0.9931 0.9932 0.9934 2.5 0.9938 0.9940 0.9941 0.9943 0.9945 0.9946 0.9948 0.9949 0.9951 0.9953 0.9955 0.9956 0.9957 0.9959 0.9960 0.9961 0.9962 0.9963 2.7 0.9965 0.9966 0.9967 0.9968 0.9969 0.9970 0.9971 0.9972 0.9973 2.8 0.9974 0.9975 0.9976 0.9977 0.9977 0.9978 0.9979 0.9979 0.9980 0.09 0 5359 0.5753 0.6141 0.6517 0.6879 0.7224 0.7549 0.7852 0.8133 0.8389 0.8621 0.8830 19015 09177 0.9319 0.9441 0.9545 0.9633 09706 0.9767 09817 0.9857 0.9890 0.9916 0.9936 0.9952 0.9964 0.9974 0.9981 2.6 29 0.9985 0.9981 0.9987 0.9982 0.9987 0.9982 09987 0.9983 0.9988 0.9984 09988 0.9984 0.9989 0.9985 0.9989 0.9986 0.9990 0.9986 0.9990 3.0 0.9989 Examples 2.30000.00;29750 +1.96; 2.0950-1 96 AAA - Percentile Score =0.50 +0.4015 = 9015 Or 90.15 percentile Percentile Score = 0.50 +0.3770 = 8770 or 87.70 percentile ACT Score Percentiles Most recent data (from 2015) Score Composite English Math Reading Percentiles Percentiles Percentiles Percentiles 36 99 99 99 99 35 99 99 99 99 34 99 98 99 98 33 99 97 98 97 32 98 95 97 95 31 96 93 96 92 30 95 92 95 89 29 92 90 93 86 28 90 88 91 84 27 87 85 88 81 26 83 82 84 78 25 79 79 78 75 24 74 74 73 71 23 68 69 67 66 22 63 64 62 61 21 56 58 57 55 20 50 52 53 48 19 43 45 49 42 18 36 40 43 36 17 30 37 31 16 24 32 27 25 15 18 27 15 21 14 12 21 6 13 7 16 11 12 13 11 10 88%EB%A974 Science Percentiles 99 99 99 98 97 96 95 94 92 90 87 83 77 70 63 56 48 40 33 27 22 17 36 16 13 9 6 10 wa 100 1 1 Covariance PERSON (HEIGHT-AVERAGE HEIGHT) (WEIGHT AVERAGE WEIGHT) 1 2 (72-68.6 (200-181) = 64.60 (62-68.6) (105-181) = 50160 (69-68,6)'(160-181) 8.40 (76-68.6)"(240.181) - 436.60 (64-68.6)*(200-181) = 8740 4 5 TOTAL 907.00 COVARIANCE = 907.00/4 = 226,75 For a example Covariance Ouw=> [CH - )* (W - Luw)] Pr (H.W) or Oew=> [(H- plu)(W-1w)]/N-1 Correlation Correlation=Pwr=0w/Chow= 226.75/(5 735104) = .775 IF INSTEAD OF HAVING A RANDOM SAMPLE AT ABOVE IT YOU HAVE A PROBABILITY DISTRIBUTION, FOR EXAMPLE FOR STOCK RETURNS, THE OTHER FORMULATIONS FOR MEAN VARIANCE AND COVARIANCE CORRELATION MAY BE CALCULATED AS: Weighted Mean: fix=Rx Pr(X) Weighted Variance o? = 2 (Rx-Hx)Pr(X) and Covariance: Oxy=[(Rx - Lix)" (Ry - Hy)] Pr (X,Y) 2. You estimate that the annual returns on Stock X and Y for different States of the Economy to be Economy Boom Average Recession Probability 45 40 .15 Stock X Return 14% 19 2 Stock Y Return 12% 11 0 14.2% Mean Variance Std. Dev 17:16 4.14% a. Complete filling in the mean, variance and standard deviation of returns for both Stock X and Stock Y E(Y)= 45(12)+.40(11)+.1500)=9.8% Var(X)=45(14-14.2)2+.40(19-14.2)2+.15(2-14.2)2 =0.018 +9.216 +22.326 = 31.56 Ox+ 5.62% 6. What is the covariance and correlation between the returns for Stock X and Stock Y? oxy=Cov(X,Y)=45(14-14 2)(12-9.8)+40((19-14.2)(11-9.8)+. 15(2-14.20- 9.8) -0.20 +2.30 +17.93=20.03 pxy-Cov(X,Y)oxoy - 20.03/(5.66)(4.14) = 0.855 


Step by Step Solution
There are 3 Steps involved in it
Step: 1

Get Instant Access to Expert-Tailored Solutions
See step-by-step solutions with expert insights and AI powered tools for academic success
Step: 2

Step: 3

Ace Your Homework with AI
Get the answers you need in no time with our AI-driven, step-by-step assistance
Get Started


