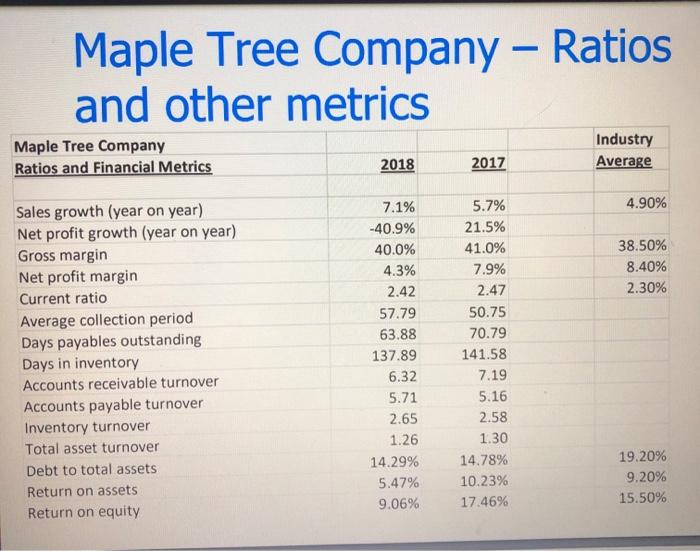
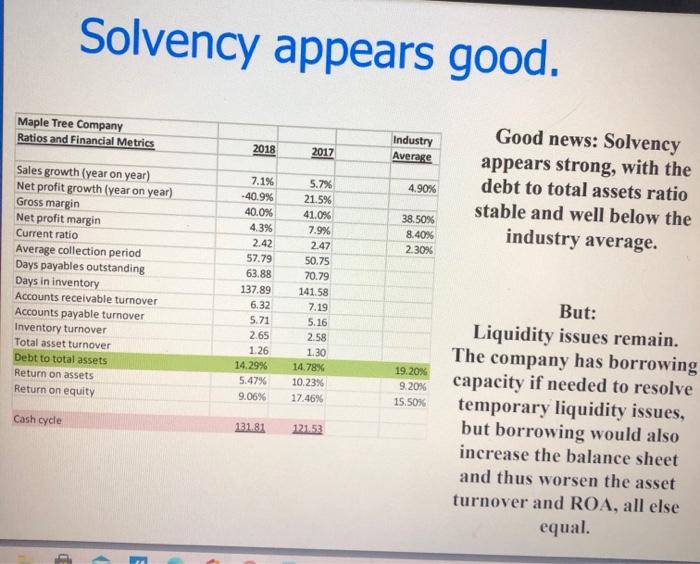
Question is there but i will also upload examples of metrics we discussed in my lectures so you're on the right track.
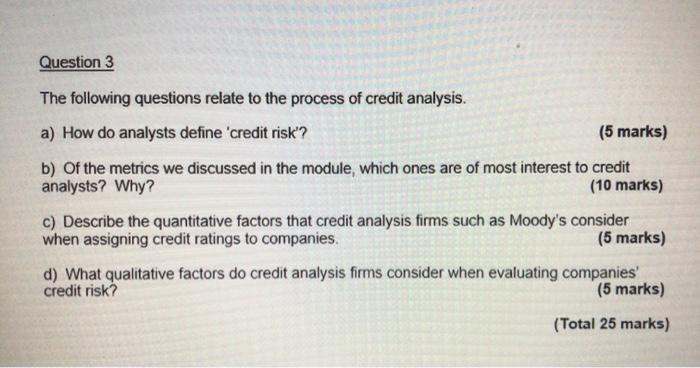
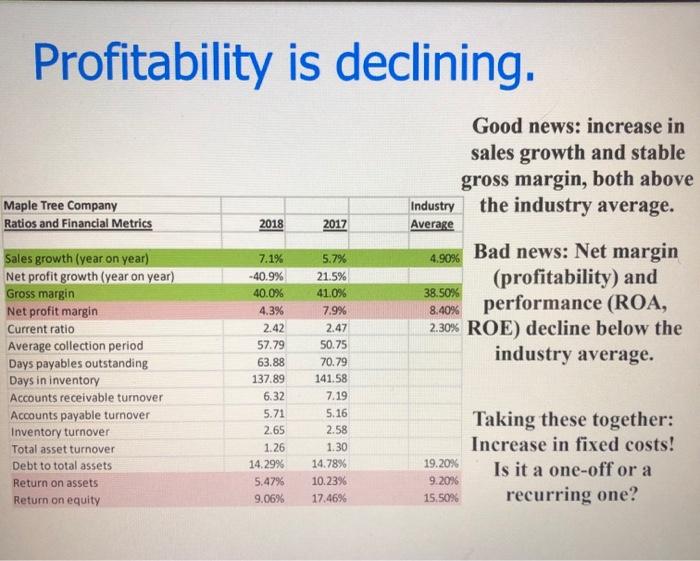
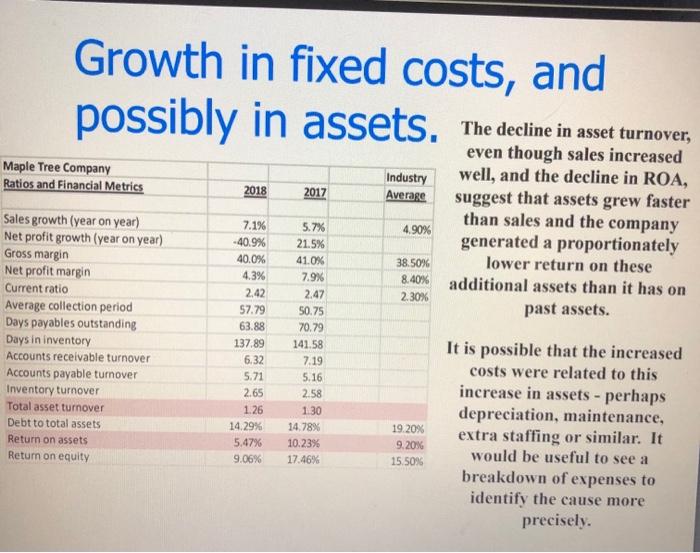
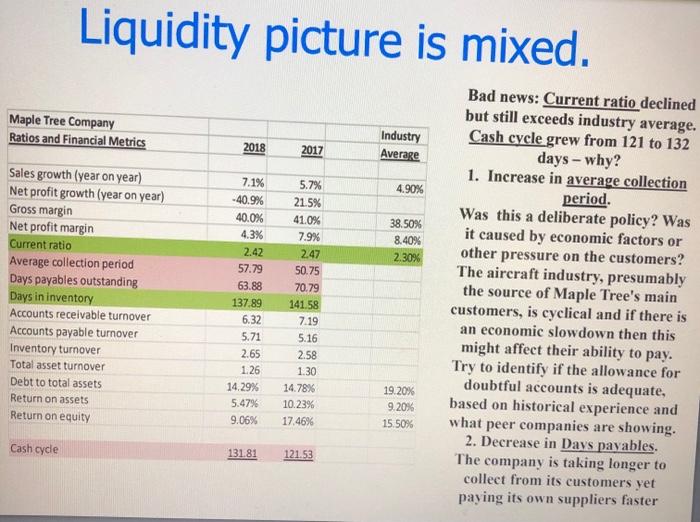
Question 3 The following questions relate to the process of credit analysis. a) How do analysts define 'credit risk'? (5 marks) b) of the metrics we discussed in the module, which ones are of most interest to credit analysts? Why? (10 marks) C) Describe the quantitative factors that credit analysis firms such as Moody's consider when assigning credit ratings to companies (5 marks) d) What qualitative factors do credit analysis firms consider when evaluating companies credit risk (5 marks) (Total 25 marks) Maple Tree Company Ratios and other metrics Maple Tree Company Ratios and Financial Metrics Industry Average 2018 2017 4.90% 38.50% 8.40% 2.30% Sales growth (year on year) Net profit growth (year on year) Gross margin Net profit margin Current ratio Average collection period Days payables outstanding Days in inventory Accounts receivable turnover Accounts payable turnover Inventory turnover Total asset turnover Debt to total assets Return on assets Return on equity 7.1% -40.9% 40.0% 4.3% 2.42 57.79 63.88 137.89 6.32 5.71 2.65 1.26 14.29% 5.47% 9.06% 5.7% 21.5% 41.0% 7.9% 2.47 50.75 70.79 141.58 7.19 5.16 2.58 1.30 14.78% 10.23% 17.46% 19.20% 9.20% 15.50% Profitability is declining. Maple Tree Company Ratios and Financial Metrics 2018 2017 Good news: increase in sales growth and stable gross margin, both above Industry the industry average. Average Bad news: Net margin (profitability) and performance (ROA, 2.30% ROE) decline below the industry average. 4.90% 38.50% 8.40% Sales growth (year on year) Net profit growth (year on year) Gross margin Net profit margin Current ratio Average collection period Days payables outstanding Days in inventory Accounts receivable turnover Accounts payable turnover Inventory turnover Total asset turnover Debt to total assets Return on assets Return on equity 7.1% -40.9% 40.0% 4.3% 2.42 57.79 63.88 137.89 6.32 5.71 2.65 1.26 14.29% 5.47% 9.06% 5.7% 21.5% 41.0% 7.9% 2.47 50.75 70.79 141.58 7.19 5.16 2.58 1.30 14.78% 10.23% 17,46% 19.20% 9.20% 15.50% Taking these together: Increase in fixed costs! Is it a one-off or a recurring one? Growth in fixed costs, and Maple Tree Company Ratios and Financial Metrics 2018 2017 Industry Average The decline in asset turnover, even though sales increased well, and the decline in ROA, suggest that assets grew faster than sales and the company generated a proportionately lower return on these additional assets than it has on past assets. 4.90% 38.50% 8.40% 2.30% Sales growth (year on year) Net profit growth (year on year) Gross margin Net profit margin Current ratio Average collection period Days payables outstanding Days in inventory Accounts receivable turnover Accounts payable turnover Inventory turnover Total asset turnover Debt to total assets Return on assets Return on equity 7.1% -40.9% 40.0% 4.3% 2.42 57.79 63.88 137.89 6.32 5.71 2.65 5.7% 21.5% 41.0% 7.9% 2.47 50.75 70.79 141.58 7.19 5.16 2.58 1.30 14.78% 10.23% 17.46% 1.26 14.29% 5.47% 9.06% 19.20% 9.20% 15.50% It is possible that the increased costs were related to this increase in assets - perhaps depreciation, maintenance, extra staffing or similar. It would be useful to see a breakdown of expenses to identify the cause more precisely. Liquidity picture is mixed. Maple Tree Company Ratios and Financial Metrics 2018 2017 Industry Average 4.90% 38.50% 8.40% 2.30% Sales growth (year on year) Net profit growth (year on year) Gross margin Net profit margin Current ratio Average collection period Days payables outstanding Days in inventory Accounts receivable turnover Accounts payable turnover Inventory turnover Total asset turnover Debt to total assets Return on assets Return on equity 7.1% -40.9% 40.0% 4.3% 2.42 57.79 63.88 137.89 6.32 5.71 2.65 1.26 14.29% 5.4796 9.06% 5.7% 21.5% 41.0% 7.9% 2.47 50.75 70.79 141.58 7.19 5.16 2.58 1.30 14.78% 10.23% 17.46% Bad news: Current ratio declined but still exceeds industry average. Cash cycle grew from 121 to 132 days - why? 1. Increase in average collection period. Was this a deliberate policy? Was it caused by economic factors or other pressure on the customers? The aircraft industry, presumably the source of Maple Tree's main customers, is cyclical and if there is an economic slow down then this might affect their ability to pay. Try to identify if the allowance for doubtful accounts is adequate, based on historical experience and what peer companies are showing. 2. Decrease in Days payables. The company is taking longer to collect from its customers yet paying its own suppliers faster 19.20% 9.20% 15.50% Cash cycle 131.81 121.53 Solvency appears good. Maple Tree Company Ratios and Financial Metrics 2018 2017 Industry Average 4.90% Good news: Solvency appears strong, with the debt to total assets ratio stable and well below the industry average. 38.50% 8.40% 2. 30% Sales growth (year on year) Net profit growth (year on year) Gross margin Net profit margin Current ratio Average collection period Days payables outstanding Days in inventory Accounts receivable turnover Accounts payable turnover Inventory turnover Total asset turnover Debt to total assets Return on assets Return on equity 7.1% -40.9% 40.0% 4.3% 2.42 57.79 63.88 137.89 6.32 5.71 2.65 1.26 14.29% 5.47% 9.06% 5.7% 21.5% 41.0% 7.9% 2.47 50.75 70.79 141.58 7.19 5.16 2.58 1.30 14.78% 10.23% 17.46% 19.20% 9.20% 15.50% Cash cycle But: Liquidity issues remain. The company has borrowing capacity if needed to resolve temporary liquidity issues, but borrowing would also increase the balance sheet and thus worsen the asset turnover and ROA, all else equal. 131.81 121.53 > Question 3 The following questions relate to the process of credit analysis. a) How do analysts define 'credit risk'? (5 marks) b) of the metrics we discussed in the module, which ones are of most interest to credit analysts? Why? (10 marks) C) Describe the quantitative factors that credit analysis firms such as Moody's consider when assigning credit ratings to companies (5 marks) d) What qualitative factors do credit analysis firms consider when evaluating companies credit risk (5 marks) (Total 25 marks) Maple Tree Company Ratios and other metrics Maple Tree Company Ratios and Financial Metrics Industry Average 2018 2017 4.90% 38.50% 8.40% 2.30% Sales growth (year on year) Net profit growth (year on year) Gross margin Net profit margin Current ratio Average collection period Days payables outstanding Days in inventory Accounts receivable turnover Accounts payable turnover Inventory turnover Total asset turnover Debt to total assets Return on assets Return on equity 7.1% -40.9% 40.0% 4.3% 2.42 57.79 63.88 137.89 6.32 5.71 2.65 1.26 14.29% 5.47% 9.06% 5.7% 21.5% 41.0% 7.9% 2.47 50.75 70.79 141.58 7.19 5.16 2.58 1.30 14.78% 10.23% 17.46% 19.20% 9.20% 15.50% Profitability is declining. Maple Tree Company Ratios and Financial Metrics 2018 2017 Good news: increase in sales growth and stable gross margin, both above Industry the industry average. Average Bad news: Net margin (profitability) and performance (ROA, 2.30% ROE) decline below the industry average. 4.90% 38.50% 8.40% Sales growth (year on year) Net profit growth (year on year) Gross margin Net profit margin Current ratio Average collection period Days payables outstanding Days in inventory Accounts receivable turnover Accounts payable turnover Inventory turnover Total asset turnover Debt to total assets Return on assets Return on equity 7.1% -40.9% 40.0% 4.3% 2.42 57.79 63.88 137.89 6.32 5.71 2.65 1.26 14.29% 5.47% 9.06% 5.7% 21.5% 41.0% 7.9% 2.47 50.75 70.79 141.58 7.19 5.16 2.58 1.30 14.78% 10.23% 17,46% 19.20% 9.20% 15.50% Taking these together: Increase in fixed costs! Is it a one-off or a recurring one? Growth in fixed costs, and Maple Tree Company Ratios and Financial Metrics 2018 2017 Industry Average The decline in asset turnover, even though sales increased well, and the decline in ROA, suggest that assets grew faster than sales and the company generated a proportionately lower return on these additional assets than it has on past assets. 4.90% 38.50% 8.40% 2.30% Sales growth (year on year) Net profit growth (year on year) Gross margin Net profit margin Current ratio Average collection period Days payables outstanding Days in inventory Accounts receivable turnover Accounts payable turnover Inventory turnover Total asset turnover Debt to total assets Return on assets Return on equity 7.1% -40.9% 40.0% 4.3% 2.42 57.79 63.88 137.89 6.32 5.71 2.65 5.7% 21.5% 41.0% 7.9% 2.47 50.75 70.79 141.58 7.19 5.16 2.58 1.30 14.78% 10.23% 17.46% 1.26 14.29% 5.47% 9.06% 19.20% 9.20% 15.50% It is possible that the increased costs were related to this increase in assets - perhaps depreciation, maintenance, extra staffing or similar. It would be useful to see a breakdown of expenses to identify the cause more precisely. Liquidity picture is mixed. Maple Tree Company Ratios and Financial Metrics 2018 2017 Industry Average 4.90% 38.50% 8.40% 2.30% Sales growth (year on year) Net profit growth (year on year) Gross margin Net profit margin Current ratio Average collection period Days payables outstanding Days in inventory Accounts receivable turnover Accounts payable turnover Inventory turnover Total asset turnover Debt to total assets Return on assets Return on equity 7.1% -40.9% 40.0% 4.3% 2.42 57.79 63.88 137.89 6.32 5.71 2.65 1.26 14.29% 5.4796 9.06% 5.7% 21.5% 41.0% 7.9% 2.47 50.75 70.79 141.58 7.19 5.16 2.58 1.30 14.78% 10.23% 17.46% Bad news: Current ratio declined but still exceeds industry average. Cash cycle grew from 121 to 132 days - why? 1. Increase in average collection period. Was this a deliberate policy? Was it caused by economic factors or other pressure on the customers? The aircraft industry, presumably the source of Maple Tree's main customers, is cyclical and if there is an economic slow down then this might affect their ability to pay. Try to identify if the allowance for doubtful accounts is adequate, based on historical experience and what peer companies are showing. 2. Decrease in Days payables. The company is taking longer to collect from its customers yet paying its own suppliers faster 19.20% 9.20% 15.50% Cash cycle 131.81 121.53 Solvency appears good. Maple Tree Company Ratios and Financial Metrics 2018 2017 Industry Average 4.90% Good news: Solvency appears strong, with the debt to total assets ratio stable and well below the industry average. 38.50% 8.40% 2. 30% Sales growth (year on year) Net profit growth (year on year) Gross margin Net profit margin Current ratio Average collection period Days payables outstanding Days in inventory Accounts receivable turnover Accounts payable turnover Inventory turnover Total asset turnover Debt to total assets Return on assets Return on equity 7.1% -40.9% 40.0% 4.3% 2.42 57.79 63.88 137.89 6.32 5.71 2.65 1.26 14.29% 5.47% 9.06% 5.7% 21.5% 41.0% 7.9% 2.47 50.75 70.79 141.58 7.19 5.16 2.58 1.30 14.78% 10.23% 17.46% 19.20% 9.20% 15.50% Cash cycle But: Liquidity issues remain. The company has borrowing capacity if needed to resolve temporary liquidity issues, but borrowing would also increase the balance sheet and thus worsen the asset turnover and ROA, all else equal. 131.81 121.53 >


