

Question
Question: IThis is the question in case study : Need to calculate NPV , APR, ROI etcetera from above data In reference to the Chow
Question: 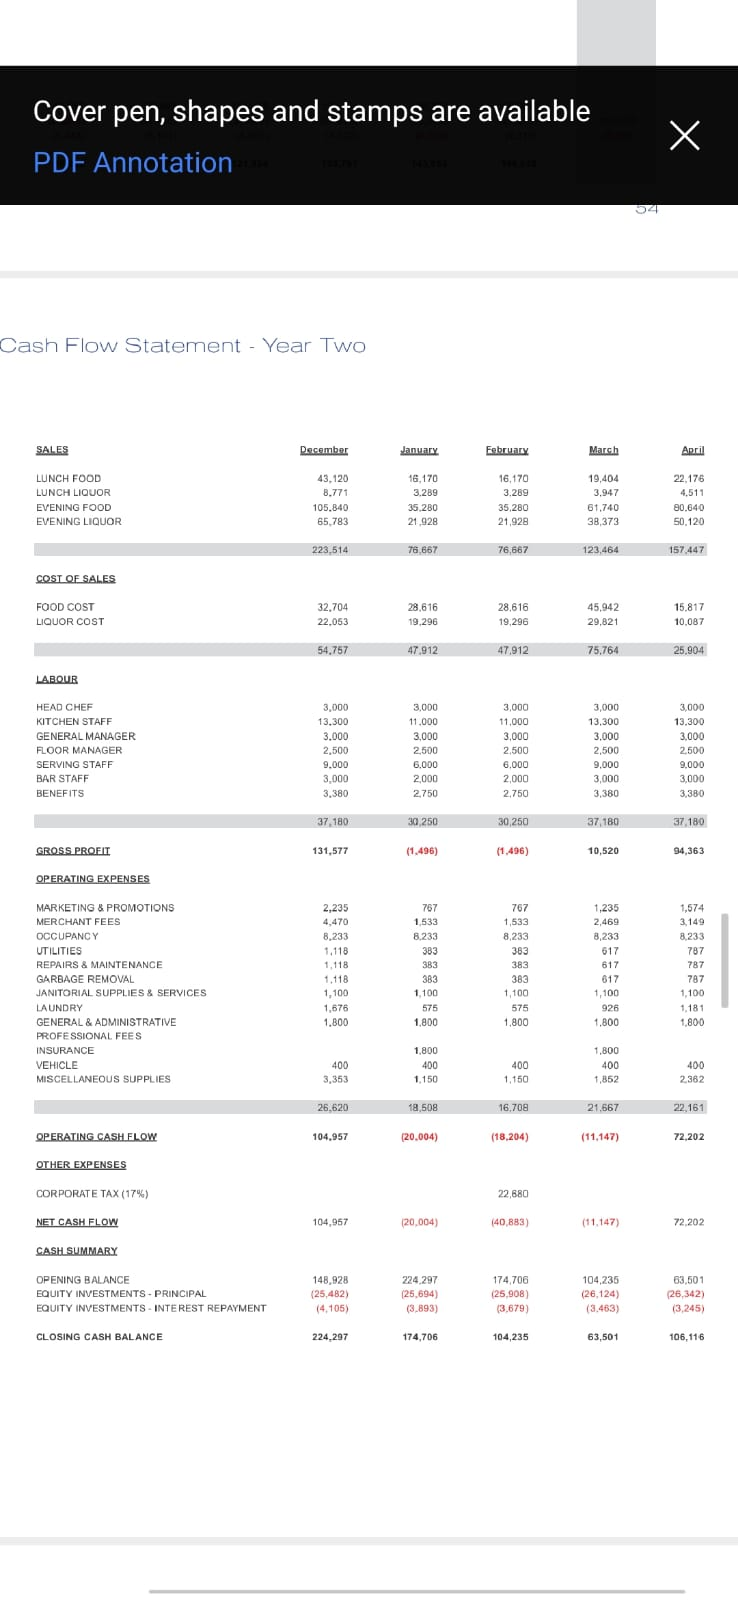
 IThis is the question in case study :
Need to calculate NPV , APR, ROI etcetera from above data In reference to the Chow business plan, present a Net Present Value Analysis for the expansion of the restaurant adjacent to its original location. You are to use capital budgeting concepts discussed this term, including but not limited to payback, return ratios (ARR, Profit Margin, ROI), and are encouraged to use the original assumptions that you specifically included in your second assignment. Marks will be awarded for the realistic nature of the figures and the depth of insight provided. When in doubt or where figures are unavailable (either in the business plan or your assignment), please identify the basis for the assumptions made.
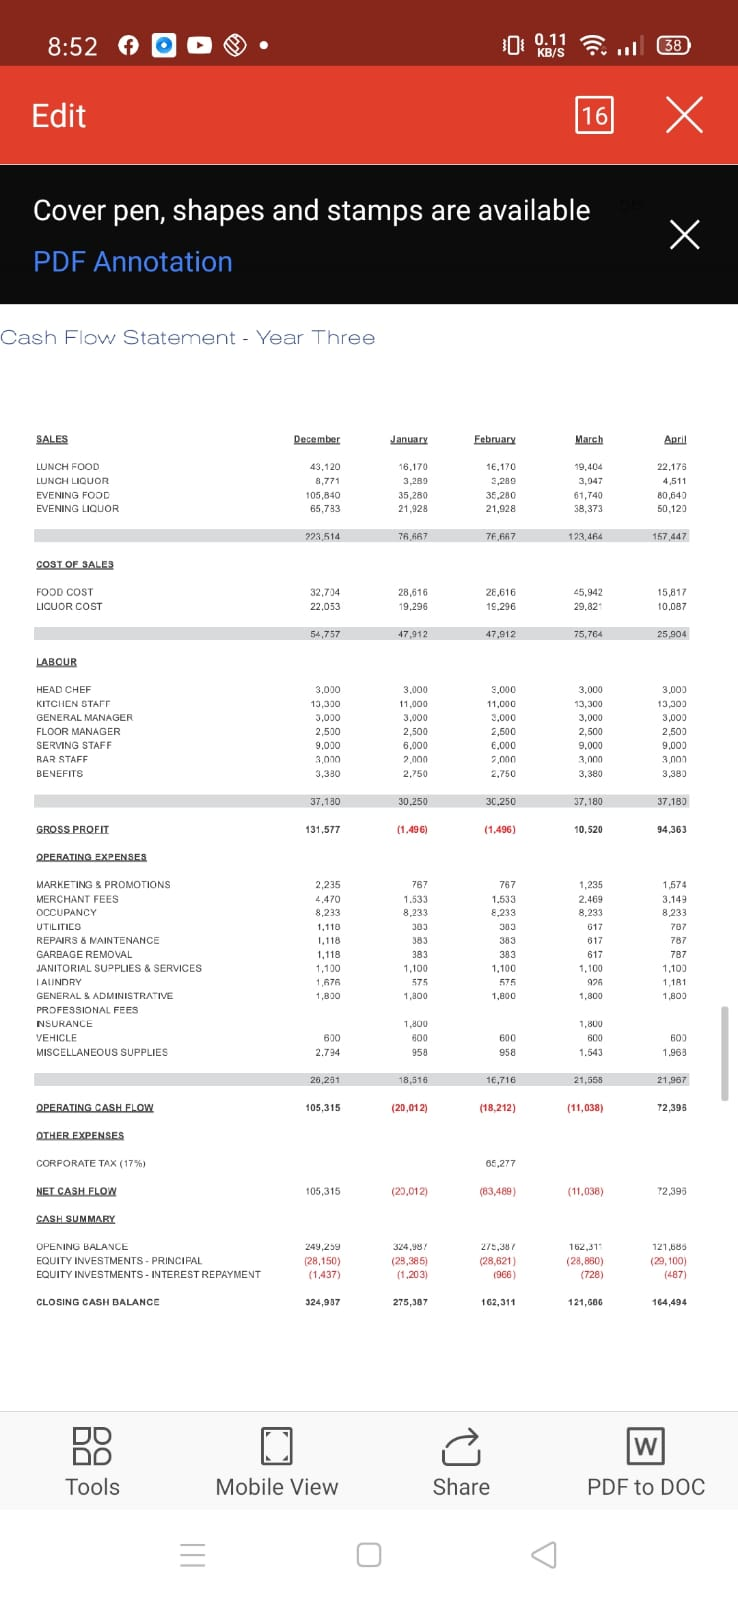
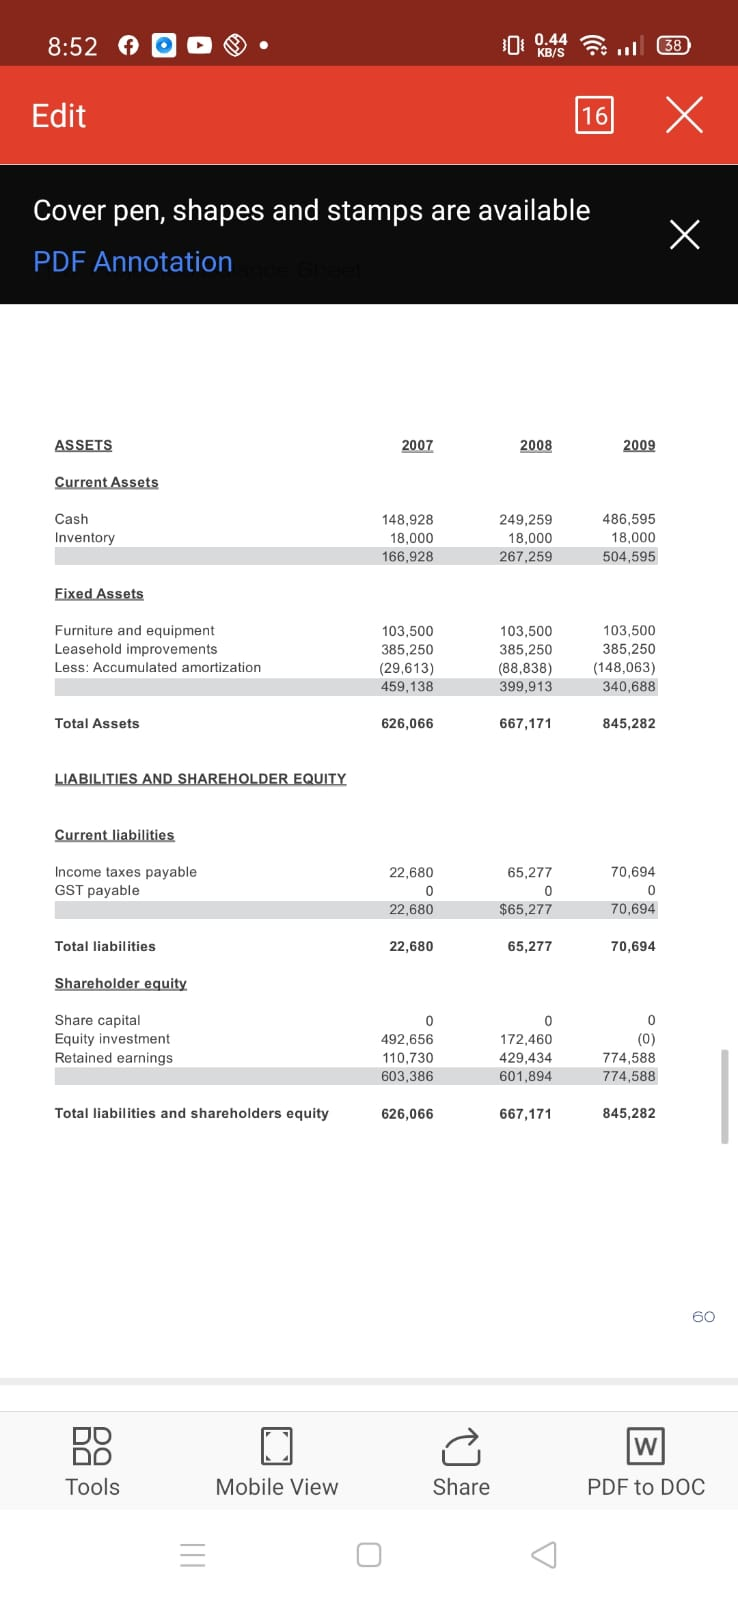
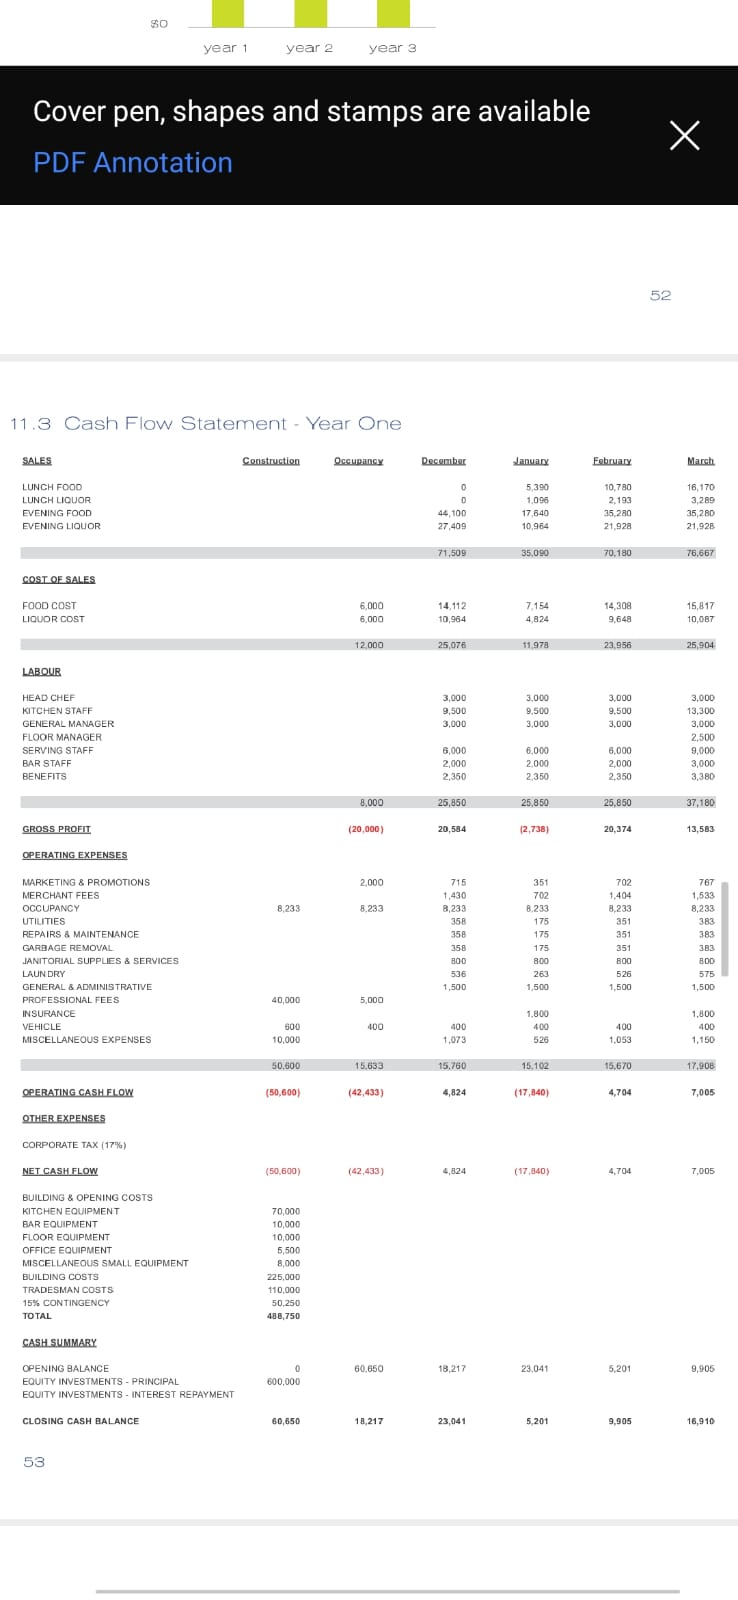
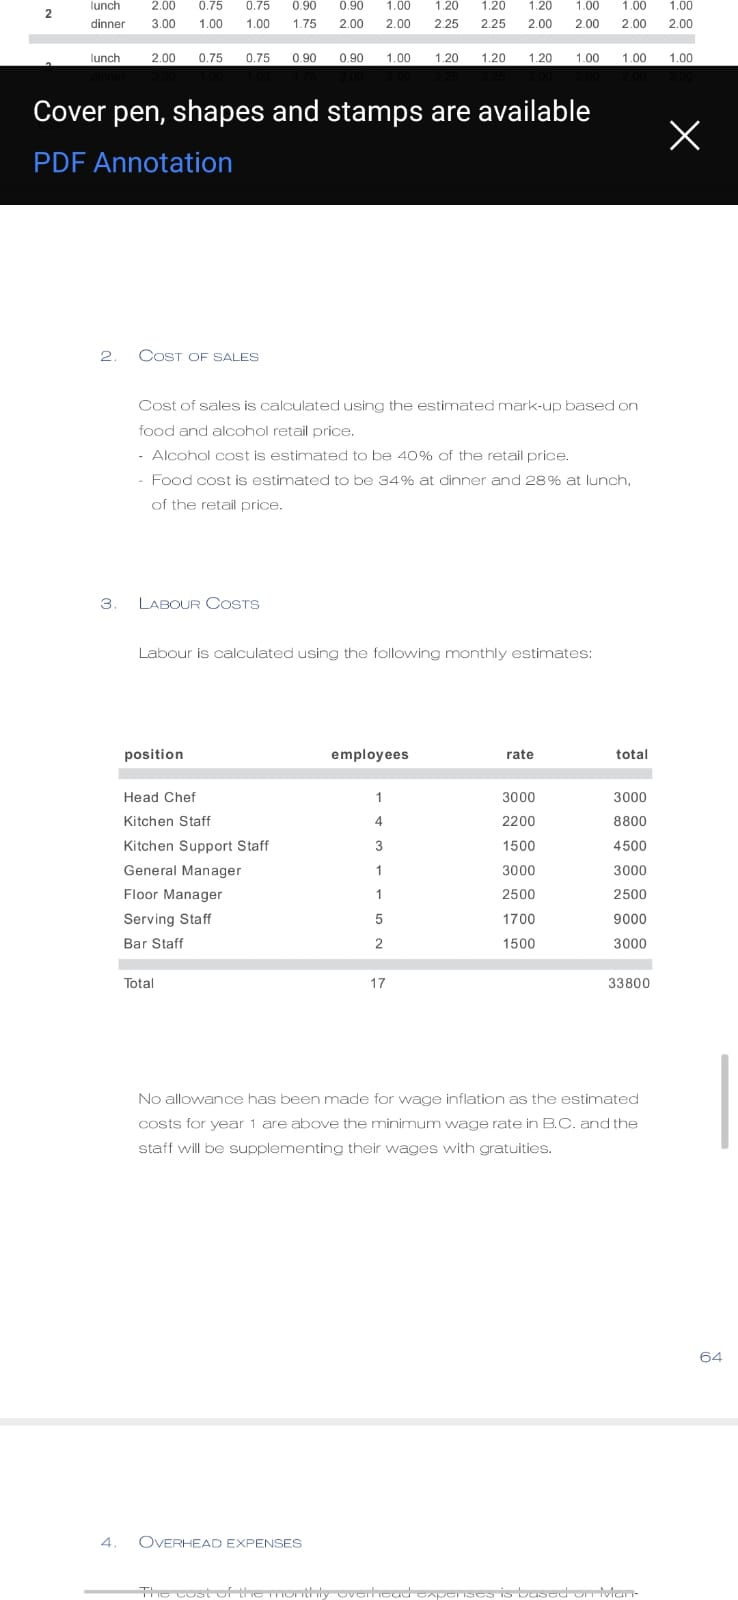
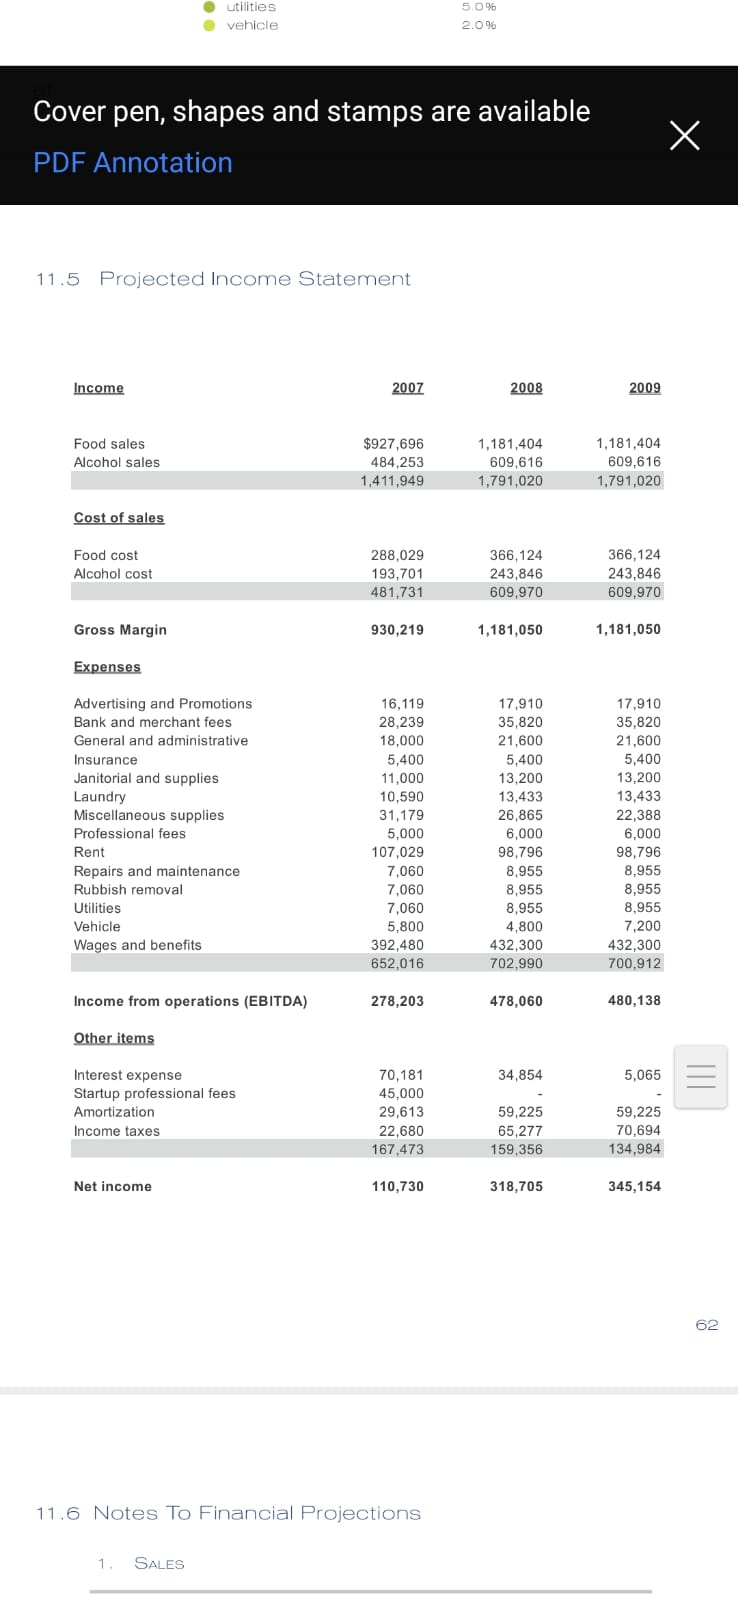
Cover pen, shapes and stamps are available X PDF Annotation 54 Cash Flow Statement - Year Two SALES December January February March April LUNCH FOOD LUNCH LIQUOR EVENING FOOD EVENING LIQUOR 43.120 8.771 105.840 65,783 16,170 3.289 35,280 21 928 16,170 3.289 35,280 21,928 19,404 3,947 61,740 38,373 22.176 4.511 80.640 50.120 223,514 76.667 76,667 123,464 157.447 COST OF SALES FOOD COST LIQUOR COST 32,704 22.053 28,616 19.296 28.616 19,296 45,942 29,821 15.817 10.087 54,757 47.912 47.912 75.764 25.904 LABOUR HEAD CHEF KITCHEN STAFF GENERAL MANAGER FLOOR MANAGER SERVING STAFF BAR STAFF BENEFITS 3,000 13.300 3,000 2,500 9.000 3,000 3.380 3,000 11.000 3,000 2,500 6.000 2,000 2.750 3,000 11,000 3,000 2,500 6.000 2,000 2.750 3,000 13,300 3.000 2.500 9,000 3,000 3,380 3,000 13.300 3.000 2.500 9,000 3,000 3,380 37.180 30 250 30,250 37,180 37.180 GROSS PROFIT 131,577 (1.496) (1.496) 10,520 94,363 OPERATING EXPENSES MARKETING & PROMOTIONS MERCHANT FEES OCCUPANCY UTILITIES REPAIRS & MAINTENANCE GARBAGE REMOVAL JANITORIAL SUPPLIES & SERVICES LAUNDRY GENERAL & ADMINISTRATIVE PROFESSIONAL FEES INSURANCE VEHICLE MISCELLANEOUS SUPPLIES 2,235 4,470 8.233 1,118 1.118 1.118 1,100 1,676 1.800 767 1,533 8.233 383 383 383 1.100 575 1,800 767 1,533 8,233 383 383 380 1,100 575 1.800 1,235 2,469 8,233 617 617 617 1,100 926 1.800 1,574 3,149 8.233 787 787 787 1,100 1,181 1.800 400 3,353 1,800 400 1.150 400 1.150 1.800 400 1,852 400 2.382 26.620 18,508 16.708 21.567 22.161 OPERATING CASH FLOW 104,957 (20.004) (18,204) (11,147) 72,202 OTHER EXPENSES CORPORATE TAX (17%) 22,880 NET CASH FLOW 104.957 20,004) (40,883) (11,147) 72,202 CASH SUMMARY OPENING BALANCE EQUITY INVESTMENTS - PRINCIPAL EQUITY INVESTMENTS - INTEREST REPAYMENT CLOSING CASH BALANCE 148,928 (25,482) (4.105) 224,297 (25,694) (3.893) 174,706 (25,908) (3.679) 104,235 (26,124) (3.463) 63,501 (26,342) (3,245) 224,297 174,706 104,235 63.501 106,116 8:52 f 0 0.11 38 KB/S Edit 16 X Cover pen, shapes and stamps are available PDF Annotation Cash Flow Statement - Year Three SALES December January February March April LUNCH FOOD LUNCH LIQUOR EVENING FOOD EVENING LIQUOR 43,120 8,771 105,840 16,170 3.289 35,280 21,928 16,170 3,280 35,280 21,928 19,404 3,047 61.740 38,373 22,178 4,511 80,640 50.120 65.733 723,514 76.667 76,667 123 454 157 447 COST OF SALES FOOD COST LICUOR COST 32,704 22,053 28,616 19,296 28,616 19.296 45,942 29,82 15,817 10.087 54,757 47.912 47.912 75,764 25,904 LABOUR HEAD CHEF KITCHEN START GENERAL MANAGER FLOOR MANAGER SERVING STAFF RAR STAFF BENEFITS 3,000 13,300 3,000 2,500 9,000 3,000 3,380 3.000 11,000 3,000 2,500 6,000 2,000 2.750 3.000 11,000 3.000 2,500 6.000 7,000 2,750 3,000 13,300 3,000 2,500 9.000 3.000 3,380 3,000 13,300 3,000 2.500 9.000 3.00 3,380 37.130 30,250 30.250 37,180 37,1BD GROSS PROFIT 131,577 (1.496) (1,496) 10,520 94,363 OPERATING EXPENSES MARKETING & PROMOTIONS MERCHANT FEES OCCUPANCY UTILITIES REPAIRS & MAINTENANCE GARBAGE REMOVAL JANITORIAL SUPPLIES & SERVICES I AUNDRY GENERAL & ADMINISTRATIVE PROFESSIONAL FEES NSURANCE VEHICLE MISCELLANEOUS SUPPLIES 2,235 4.470 8,233 1.110 1.118 1,118 1,100 1,676 1,800 767 1.533 8,233 303 383 383 1.100 575 1,800 767 1,533 8.233 303 383 383 1,100 575 1,800 1,235 2.469 8,233 617 817 617 1,100 926 1,800 1,574 3.149 8,233 787 787 787 1,100 1,181 1,800 600 2.794 1,800 600 953 600 958 1,800 600 1.543 600 1.963 26,281 18,516 16,716 21,555 21,967 OPERATING CASHELOW 105,315 (20.012) (18,212) (11,038) 72,395 OTHER EXPENSES CORPORATE TAX (17%) 65,277 NET CASH FLOW 105,315 (23,012) (83,489) (11,038) 72,398 CASH SUMMARY OPENING BALANCE EQUITY INVESTMENTS - PRINCIPAL EQUITY INVESTMENTS - INTEREST REPAYMENT 249,259 (28,150) (1.437) 324.987 (29,385) (1.203) 275,387 (28,621) 1966) 162,31 (28,860) (728) 121.686 (29,100) (487) CLOSING CASH BALANCE 324,937 275,307 162,311 121,60G 164,494 W DD DD Tools Mobile View Share PDF to DOC 8:52 0 0.44 38 KB/S Edit 16 X Cover pen, shapes and stamps are available PDF Annotation ASSETS 2007 2008 2009 Current Assets Cash Inventory 148,928 18,000 166,928 249,259 18,000 267,259 486,595 18,000 504,595 Fixed Assets Furniture and equipment Leasehold improvements Less: Accumulated amortization 103,500 385,250 (29,613) 459,138 103,500 385,250 (88,838) 399,913 103,500 385,250 (148,063) 340,688 Total Assets 626,066 667,171 845,282 LIABILITIES AND SHAREHOLDER EQUITY Current liabilities Income taxes payable GST payable 22,680 0 22,680 65,277 0 $65,277 70,694 0 70,694 Total liabilities 22,680 65,277 70,694 Shareholder equity 0 Share capital Equity investment Retained earnings 0 492,656 110,730 603,386 172,460 429,434 601,894 (0) 774.588 774,588 Total liabilities and shareholders equity 626,066 667,171 845,282 60 W DD DD Tools Mobile View Share PDF to DOC SO year 1 year 2 year 3 Cover pen, shapes and stamps are available PDF Annotation X 52 11.3 Cash Flow Statement - Year One SALES Construction Occupancy December January February March LUNCH FOOD LUNCH LIQUOR EVENING FOOD EVENING LIQUOR 0 D 44,100 27,409 5,390 1,096 17,840 10.964 10.780 2,193 35,280 21,928 16,170 3,289 35,280 21,928 71,509 35,090 70,180 76,667 COST OF SALES FOOD COST LIQUOR COST 6,000 6,000 14.112 10,964 7.154 4,824 14,308 9.648 15,817 10,087 12 000 25,076 11.978 23.956 25,904 LABOUR 3,000 9,500 3,000 3,000 9.500 3,000 3,000 9.500 3,000 HEAD CHEF KITCHEN STAFF GENERAL MANAGER FLOOR MANAGER SERVING STAFF BAR STAFF BENEFITS 3,000 13,300 3,000 2,500 9,000 3,000 3.380 6,000 2,000 2,350 6,000 2,000 2.350 6,000 2,000 2,350 8,000 25,850 25,850 25,850 37,180 GROSS PROFIT (20.000) 20,584 12.738) 20,374 13,583 OPERATING EXPENSES 2,000 8,233 8.233 MARKETING & PROMOTIONS MERCHANT FEES OCCUPANCY UTILITIES REPAIRS & MAINTENANCE GARBAGE REMOVAL JANITORIAL SUPPLIES & SERVICES LAUNDRY GENERAL & ADMINISTRATIVE PROFESSIONAL FEES INSURANCE VEHICLE MISCELLANEOUS EXPENSES 715 1,430 8,233 358 358 358 800 536 1,500 351 702 8.233 175 175 175 800 263 1,500 702 1,404 8,233 351 351 351 BOO 526 1,500 767 1,533 8,233 383 383 383 BOD 575 1,500 40,000 5,000 200 600 10,000 400 1,073 1.800 400 526 400 1,053 1,800 400 1,150 50,600 15,633 15.760 15.102 15,670 17.908 OPERATING CASH FLOW (50.600 (42,433 4,824 (17,840) 4,704 7,005 OTHER EXPENSES CORPORATE TAX (17%) NET CASH FLOW (50,600) (42,433) (17,340) 4,704 7,005 BUILDING & OPENING COSTS KITCHEN EQUIPMENT BAR EQUIPMENT FLOOR EQUIPMENT OFFICE EQUIPMENT MISCELLANEOUS SMALL EQUIPMENT BUILDING COSTS TRADESMAN COSTS 15% CONTINGENCY TOTAL 70,000 10,000 10,000 5,500 8,000 225,000 110,000 50,250 488,750 CASH SUMMARY 60.650 18.217 23,041 5.201 9,905 OPENING BALANCE EQUITY INVESTMENTS - PRINCIPAL EQUITY INVESTMENTS - INTEREST REPAYMENT 0 600,000 CLOSING CASH BALANCE 60,650 18,217 23,041 5,201 9,905 16,910 53 2 lunch dinner 2.00 3.00 0.75 1.00 0.75 1.00 0.90 1.75 0.90 2.00 1.00 2.00 1.20 2.25 1.20 2.25 1.20 2.00 1.00 2.00 1.00 2.00 1.00 2.00 lunch 2.00 0.75 0.75 0.90 0.90 1.00 1.20 1.20 1.20 1.00 1.00 1.00 Cover pen, shapes and stamps are available PDF Annotation 2 COST OF SALES Cost of sales is calculated using the estimated mark-up based on food and alcohol retail price. Alcohol cost is estimated to be 40% of the retail price. - Food cost is estimated to be 34% at dinner and 28% at lunch, of the retail price. 3 LABOUR COSTS Labour is calculated using the following monthly estimates: position employees rate total 1 3000 3000 Head Chef Kitchen Staff 4 2200 8800 3 1500 4500 1 Kitchen Support Staff General Manager Floor Manager Serving Staff Bar Staff 3000 2500 3000 2500 9000 5 1700 2 1500 3000 Total 17 33800 No allowance has been made for wage inflation as the estimated costs for year 1 are above the minimum wage rate in B.C. and the staff will be supplementing their wages with gratuities. 64 4 OVERHEAD EXPENSES The cost of the monthly Overload SACHSes is based on van utilities vehicle 5.0% 2.0% Cover pen, shapes and stamps are available X PDF Annotation 11.5 Projected Income Statement Income 2007 2008 2009 Food sales Alcohol sales $927,696 484,253 1.411,949 1,181,404 609,616 1.791,020 1,181,404 609,616 1.791,020 Cost of sales Food cost Alcohol cost 288,029 193,701 481,731 366,124 243,846 609,970 366,124 243,846 609,970 Gross Margin 930,219 1,181,050 1,181,050 Expenses Advertising and Promotions Bank and merchant fees General and administrative Insurance Janitorial and supplies Laundry Miscellaneous supplies Professional fees Rent Repairs and maintenance Rubbish removal Utilities Vehicle Wages and benefits 16,119 28,239 18,000 5,400 11,000 10,590 31,179 5,000 107,029 7,060 7,060 7,060 5,800 392,480 652,016 17,910 35,820 21,600 5,400 13,200 13,433 26,865 6,000 98,796 8.955 8,955 8,955 4.800 432,300 702,990 17,910 35,820 21,600 5,400 13,200 13,433 22,388 6,000 98,796 8,955 8,955 8.955 7,200 432,300 700,912 Income from operations (EBITDA) 278,203 478,060 480,138 Other items 34,854 5,065 Interest expense Startup professional fees Amortization Income taxes 70,181 45,000 29,613 22.680 167,473 59,225 65,277 159.356 59,225 70,694 134,984 Net income 110,730 318,705 345,154 62 11.6 Notes To Financial Projections 1. SALES Cover pen, shapes and stamps are available X PDF Annotation 54 Cash Flow Statement - Year Two SALES December January February March April LUNCH FOOD LUNCH LIQUOR EVENING FOOD EVENING LIQUOR 43.120 8.771 105.840 65,783 16,170 3.289 35,280 21 928 16,170 3.289 35,280 21,928 19,404 3,947 61,740 38,373 22.176 4.511 80.640 50.120 223,514 76.667 76,667 123,464 157.447 COST OF SALES FOOD COST LIQUOR COST 32,704 22.053 28,616 19.296 28.616 19,296 45,942 29,821 15.817 10.087 54,757 47.912 47.912 75.764 25.904 LABOUR HEAD CHEF KITCHEN STAFF GENERAL MANAGER FLOOR MANAGER SERVING STAFF BAR STAFF BENEFITS 3,000 13.300 3,000 2,500 9.000 3,000 3.380 3,000 11.000 3,000 2,500 6.000 2,000 2.750 3,000 11,000 3,000 2,500 6.000 2,000 2.750 3,000 13,300 3.000 2.500 9,000 3,000 3,380 3,000 13.300 3.000 2.500 9,000 3,000 3,380 37.180 30 250 30,250 37,180 37.180 GROSS PROFIT 131,577 (1.496) (1.496) 10,520 94,363 OPERATING EXPENSES MARKETING & PROMOTIONS MERCHANT FEES OCCUPANCY UTILITIES REPAIRS & MAINTENANCE GARBAGE REMOVAL JANITORIAL SUPPLIES & SERVICES LAUNDRY GENERAL & ADMINISTRATIVE PROFESSIONAL FEES INSURANCE VEHICLE MISCELLANEOUS SUPPLIES 2,235 4,470 8.233 1,118 1.118 1.118 1,100 1,676 1.800 767 1,533 8.233 383 383 383 1.100 575 1,800 767 1,533 8,233 383 383 380 1,100 575 1.800 1,235 2,469 8,233 617 617 617 1,100 926 1.800 1,574 3,149 8.233 787 787 787 1,100 1,181 1.800 400 3,353 1,800 400 1.150 400 1.150 1.800 400 1,852 400 2.382 26.620 18,508 16.708 21.567 22.161 OPERATING CASH FLOW 104,957 (20.004) (18,204) (11,147) 72,202 OTHER EXPENSES CORPORATE TAX (17%) 22,880 NET CASH FLOW 104.957 20,004) (40,883) (11,147) 72,202 CASH SUMMARY OPENING BALANCE EQUITY INVESTMENTS - PRINCIPAL EQUITY INVESTMENTS - INTEREST REPAYMENT CLOSING CASH BALANCE 148,928 (25,482) (4.105) 224,297 (25,694) (3.893) 174,706 (25,908) (3.679) 104,235 (26,124) (3.463) 63,501 (26,342) (3,245) 224,297 174,706 104,235 63.501 106,116 8:52 f 0 0.11 38 KB/S Edit 16 X Cover pen, shapes and stamps are available PDF Annotation Cash Flow Statement - Year Three SALES December January February March April LUNCH FOOD LUNCH LIQUOR EVENING FOOD EVENING LIQUOR 43,120 8,771 105,840 16,170 3.289 35,280 21,928 16,170 3,280 35,280 21,928 19,404 3,047 61.740 38,373 22,178 4,511 80,640 50.120 65.733 723,514 76.667 76,667 123 454 157 447 COST OF SALES FOOD COST LICUOR COST 32,704 22,053 28,616 19,296 28,616 19.296 45,942 29,82 15,817 10.087 54,757 47.912 47.912 75,764 25,904 LABOUR HEAD CHEF KITCHEN START GENERAL MANAGER FLOOR MANAGER SERVING STAFF RAR STAFF BENEFITS 3,000 13,300 3,000 2,500 9,000 3,000 3,380 3.000 11,000 3,000 2,500 6,000 2,000 2.750 3.000 11,000 3.000 2,500 6.000 7,000 2,750 3,000 13,300 3,000 2,500 9.000 3.000 3,380 3,000 13,300 3,000 2.500 9.000 3.00 3,380 37.130 30,250 30.250 37,180 37,1BD GROSS PROFIT 131,577 (1.496) (1,496) 10,520 94,363 OPERATING EXPENSES MARKETING & PROMOTIONS MERCHANT FEES OCCUPANCY UTILITIES REPAIRS & MAINTENANCE GARBAGE REMOVAL JANITORIAL SUPPLIES & SERVICES I AUNDRY GENERAL & ADMINISTRATIVE PROFESSIONAL FEES NSURANCE VEHICLE MISCELLANEOUS SUPPLIES 2,235 4.470 8,233 1.110 1.118 1,118 1,100 1,676 1,800 767 1.533 8,233 303 383 383 1.100 575 1,800 767 1,533 8.233 303 383 383 1,100 575 1,800 1,235 2.469 8,233 617 817 617 1,100 926 1,800 1,574 3.149 8,233 787 787 787 1,100 1,181 1,800 600 2.794 1,800 600 953 600 958 1,800 600 1.543 600 1.963 26,281 18,516 16,716 21,555 21,967 OPERATING CASHELOW 105,315 (20.012) (18,212) (11,038) 72,395 OTHER EXPENSES CORPORATE TAX (17%) 65,277 NET CASH FLOW 105,315 (23,012) (83,489) (11,038) 72,398 CASH SUMMARY OPENING BALANCE EQUITY INVESTMENTS - PRINCIPAL EQUITY INVESTMENTS - INTEREST REPAYMENT 249,259 (28,150) (1.437) 324.987 (29,385) (1.203) 275,387 (28,621) 1966) 162,31 (28,860) (728) 121.686 (29,100) (487) CLOSING CASH BALANCE 324,937 275,307 162,311 121,60G 164,494 W DD DD Tools Mobile View Share PDF to DOC 8:52 0 0.44 38 KB/S Edit 16 X Cover pen, shapes and stamps are available PDF Annotation ASSETS 2007 2008 2009 Current Assets Cash Inventory 148,928 18,000 166,928 249,259 18,000 267,259 486,595 18,000 504,595 Fixed Assets Furniture and equipment Leasehold improvements Less: Accumulated amortization 103,500 385,250 (29,613) 459,138 103,500 385,250 (88,838) 399,913 103,500 385,250 (148,063) 340,688 Total Assets 626,066 667,171 845,282 LIABILITIES AND SHAREHOLDER EQUITY Current liabilities Income taxes payable GST payable 22,680 0 22,680 65,277 0 $65,277 70,694 0 70,694 Total liabilities 22,680 65,277 70,694 Shareholder equity 0 Share capital Equity investment Retained earnings 0 492,656 110,730 603,386 172,460 429,434 601,894 (0) 774.588 774,588 Total liabilities and shareholders equity 626,066 667,171 845,282 60 W DD DD Tools Mobile View Share PDF to DOC SO year 1 year 2 year 3 Cover pen, shapes and stamps are available PDF Annotation X 52 11.3 Cash Flow Statement - Year One SALES Construction Occupancy December January February March LUNCH FOOD LUNCH LIQUOR EVENING FOOD EVENING LIQUOR 0 D 44,100 27,409 5,390 1,096 17,840 10.964 10.780 2,193 35,280 21,928 16,170 3,289 35,280 21,928 71,509 35,090 70,180 76,667 COST OF SALES FOOD COST LIQUOR COST 6,000 6,000 14.112 10,964 7.154 4,824 14,308 9.648 15,817 10,087 12 000 25,076 11.978 23.956 25,904 LABOUR 3,000 9,500 3,000 3,000 9.500 3,000 3,000 9.500 3,000 HEAD CHEF KITCHEN STAFF GENERAL MANAGER FLOOR MANAGER SERVING STAFF BAR STAFF BENEFITS 3,000 13,300 3,000 2,500 9,000 3,000 3.380 6,000 2,000 2,350 6,000 2,000 2.350 6,000 2,000 2,350 8,000 25,850 25,850 25,850 37,180 GROSS PROFIT (20.000) 20,584 12.738) 20,374 13,583 OPERATING EXPENSES 2,000 8,233 8.233 MARKETING & PROMOTIONS MERCHANT FEES OCCUPANCY UTILITIES REPAIRS & MAINTENANCE GARBAGE REMOVAL JANITORIAL SUPPLIES & SERVICES LAUNDRY GENERAL & ADMINISTRATIVE PROFESSIONAL FEES INSURANCE VEHICLE MISCELLANEOUS EXPENSES 715 1,430 8,233 358 358 358 800 536 1,500 351 702 8.233 175 175 175 800 263 1,500 702 1,404 8,233 351 351 351 BOO 526 1,500 767 1,533 8,233 383 383 383 BOD 575 1,500 40,000 5,000 200 600 10,000 400 1,073 1.800 400 526 400 1,053 1,800 400 1,150 50,600 15,633 15.760 15.102 15,670 17.908 OPERATING CASH FLOW (50.600 (42,433 4,824 (17,840) 4,704 7,005 OTHER EXPENSES CORPORATE TAX (17%) NET CASH FLOW (50,600) (42,433) (17,340) 4,704 7,005 BUILDING & OPENING COSTS KITCHEN EQUIPMENT BAR EQUIPMENT FLOOR EQUIPMENT OFFICE EQUIPMENT MISCELLANEOUS SMALL EQUIPMENT BUILDING COSTS TRADESMAN COSTS 15% CONTINGENCY TOTAL 70,000 10,000 10,000 5,500 8,000 225,000 110,000 50,250 488,750 CASH SUMMARY 60.650 18.217 23,041 5.201 9,905 OPENING BALANCE EQUITY INVESTMENTS - PRINCIPAL EQUITY INVESTMENTS - INTEREST REPAYMENT 0 600,000 CLOSING CASH BALANCE 60,650 18,217 23,041 5,201 9,905 16,910 53 2 lunch dinner 2.00 3.00 0.75 1.00 0.75 1.00 0.90 1.75 0.90 2.00 1.00 2.00 1.20 2.25 1.20 2.25 1.20 2.00 1.00 2.00 1.00 2.00 1.00 2.00 lunch 2.00 0.75 0.75 0.90 0.90 1.00 1.20 1.20 1.20 1.00 1.00 1.00 Cover pen, shapes and stamps are available PDF Annotation 2 COST OF SALES Cost of sales is calculated using the estimated mark-up based on food and alcohol retail price. Alcohol cost is estimated to be 40% of the retail price. - Food cost is estimated to be 34% at dinner and 28% at lunch, of the retail price. 3 LABOUR COSTS Labour is calculated using the following monthly estimates: position employees rate total 1 3000 3000 Head Chef Kitchen Staff 4 2200 8800 3 1500 4500 1 Kitchen Support Staff General Manager Floor Manager Serving Staff Bar Staff 3000 2500 3000 2500 9000 5 1700 2 1500 3000 Total 17 33800 No allowance has been made for wage inflation as the estimated costs for year 1 are above the minimum wage rate in B.C. and the staff will be supplementing their wages with gratuities. 64 4 OVERHEAD EXPENSES The cost of the monthly Overload SACHSes is based on van utilities vehicle 5.0% 2.0% Cover pen, shapes and stamps are available X PDF Annotation 11.5 Projected Income Statement Income 2007 2008 2009 Food sales Alcohol sales $927,696 484,253 1.411,949 1,181,404 609,616 1.791,020 1,181,404 609,616 1.791,020 Cost of sales Food cost Alcohol cost 288,029 193,701 481,731 366,124 243,846 609,970 366,124 243,846 609,970 Gross Margin 930,219 1,181,050 1,181,050 Expenses Advertising and Promotions Bank and merchant fees General and administrative Insurance Janitorial and supplies Laundry Miscellaneous supplies Professional fees Rent Repairs and maintenance Rubbish removal Utilities Vehicle Wages and benefits 16,119 28,239 18,000 5,400 11,000 10,590 31,179 5,000 107,029 7,060 7,060 7,060 5,800 392,480 652,016 17,910 35,820 21,600 5,400 13,200 13,433 26,865 6,000 98,796 8.955 8,955 8,955 4.800 432,300 702,990 17,910 35,820 21,600 5,400 13,200 13,433 22,388 6,000 98,796 8,955 8,955 8.955 7,200 432,300 700,912 Income from operations (EBITDA) 278,203 478,060 480,138 Other items 34,854 5,065 Interest expense Startup professional fees Amortization Income taxes 70,181 45,000 29,613 22.680 167,473 59,225 65,277 159.356 59,225 70,694 134,984 Net income 110,730 318,705 345,154 62 11.6 Notes To Financial Projections 1. SALESStep by Step Solution
There are 3 Steps involved in it
Step: 1

Get Instant Access to Expert-Tailored Solutions
See step-by-step solutions with expert insights and AI powered tools for academic success
Step: 2

Step: 3
Ace Your Homework with AI
Get the answers you need in no time with our AI-driven, step-by-step assistance
Get Started
IRS Audit Protection And Survival Guide Bars And Restaurants
Authors: Gerald F. Bernard, Daniel J. Baran
1st Edition
0471166375, 978-0471166375