Answered step by step
Verified Expert Solution
Question
1 Approved Answer
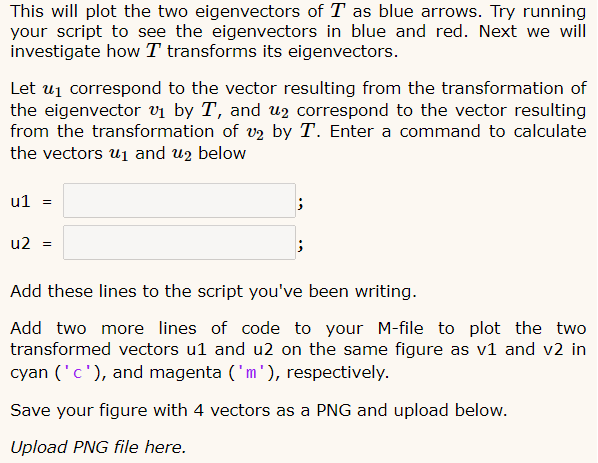
Question one and two are already solved: u1 = v1*T, u2 = v2*T Please help me on the third question. Exercise 3 In this exercise


Question one and two are already solved: u1 = v1*T, u2 = v2*T
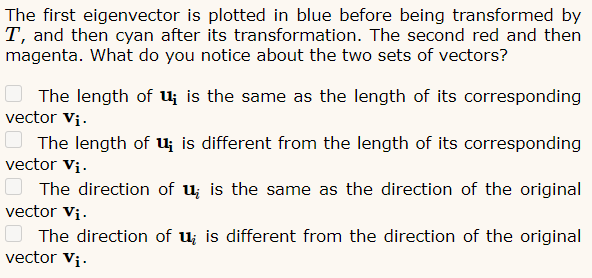
Please help me on the third question.
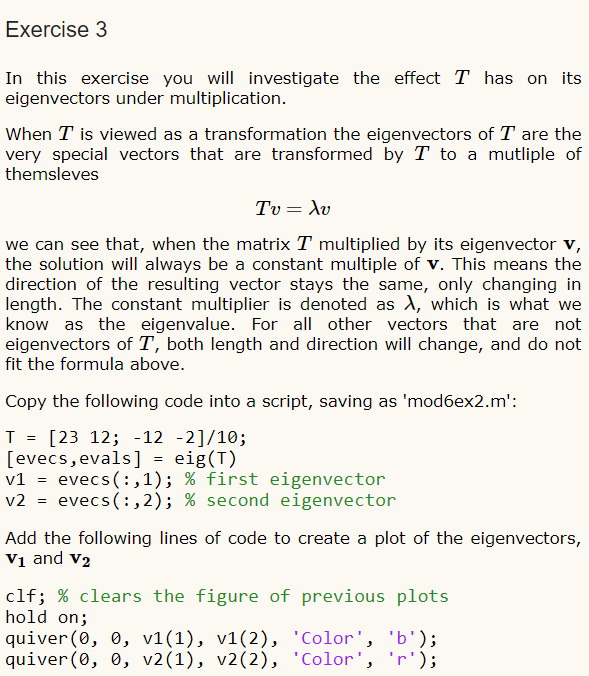
Exercise 3 In this exercise you will investigate the effect T has on its eigenvectors under multiplication. When T is viewed as a transformation the eigenvectors of T are the very special vectors that are transformed by T to a mutliple of themsleves Tu= lv we can see that, when the matrix T multiplied by its eigenvector v, the solution will always be a constant multiple of v. This means the direction of the resulting vector stays the same, only changing in length. The constant multiplier is denoted as ), which is what we know as the eigenvalue. For all other vectors that are not eigenvectors of T, both length and direction will change, and do not fit the formula above. Copy the following code into a script, saving as 'mod6ex2.m': T = [23 12; -12 -2]/10; [evecs, evals] = eig(T) v1 = evecs(:,1); % first eigenvector v2 = evecs(:,2); % second eigenvector Add the following lines of code to create a plot of the eigenvectors, V1 and V2 clf; % clears the figure of previous plots hold on; quiver(0, 0, v1(1), v1(2), 'Color', 'b'); quiver(0, 0, V2(1), 12(2), 'Color', 'r'); This will plot the two eigenvectors of T as blue arrows. Try running your script to see the eigenvectors in blue and red. Next we will investigate how T transforms its eigenvectors. Let ui correspond to the vector resulting from the transformation of the eigenvector vi by T, and u2 correspond to the vector resulting from the transformation of v2 by T. Enter a command to calculate the vectors U1 and uz below u1 ; u2 = Add these lines to the script you've been writing. Add two more lines of code to your M-file to plot the two transformed vectors ul and u2 on the same figure as v1 and v2 in cyan ('c'), and magenta ('m'), respectively. Save your figure with 4 vectors as a PNG and upload below. Upload PNG file here. The first eigenvector is plotted in blue before being transformed by T, and then cyan after its transformation. The second red and then magenta. What do you notice about the two sets of vectors? The length of u; is the same as the length of its corresponding vector Vi. The length of u; is different from the length of its corresponding vector Vi. The direction of u; is the same as the direction of the original vector Vi. The direction of ui is different from the direction of the original vector Vi Exercise 3 In this exercise you will investigate the effect T has on its eigenvectors under multiplication. When T is viewed as a transformation the eigenvectors of T are the very special vectors that are transformed by T to a mutliple of themsleves Tu= lv we can see that, when the matrix T multiplied by its eigenvector v, the solution will always be a constant multiple of v. This means the direction of the resulting vector stays the same, only changing in length. The constant multiplier is denoted as ), which is what we know as the eigenvalue. For all other vectors that are not eigenvectors of T, both length and direction will change, and do not fit the formula above. Copy the following code into a script, saving as 'mod6ex2.m': T = [23 12; -12 -2]/10; [evecs, evals] = eig(T) v1 = evecs(:,1); % first eigenvector v2 = evecs(:,2); % second eigenvector Add the following lines of code to create a plot of the eigenvectors, V1 and V2 clf; % clears the figure of previous plots hold on; quiver(0, 0, v1(1), v1(2), 'Color', 'b'); quiver(0, 0, V2(1), 12(2), 'Color', 'r'); This will plot the two eigenvectors of T as blue arrows. Try running your script to see the eigenvectors in blue and red. Next we will investigate how T transforms its eigenvectors. Let ui correspond to the vector resulting from the transformation of the eigenvector vi by T, and u2 correspond to the vector resulting from the transformation of v2 by T. Enter a command to calculate the vectors U1 and uz below u1 ; u2 = Add these lines to the script you've been writing. Add two more lines of code to your M-file to plot the two transformed vectors ul and u2 on the same figure as v1 and v2 in cyan ('c'), and magenta ('m'), respectively. Save your figure with 4 vectors as a PNG and upload below. Upload PNG file here. The first eigenvector is plotted in blue before being transformed by T, and then cyan after its transformation. The second red and then magenta. What do you notice about the two sets of vectors? The length of u; is the same as the length of its corresponding vector Vi. The length of u; is different from the length of its corresponding vector Vi. The direction of u; is the same as the direction of the original vector Vi. The direction of ui is different from the direction of the original vector ViStep by Step Solution
There are 3 Steps involved in it
Step: 1

Get Instant Access to Expert-Tailored Solutions
See step-by-step solutions with expert insights and AI powered tools for academic success
Step: 2

Step: 3

Ace Your Homework with AI
Get the answers you need in no time with our AI-driven, step-by-step assistance
Get Started


