Question
Question One (a)Set out briefly (without substantial discussion) the principal determinants of the supply function for sea transport capacity.Which of these, and briefly why, would
Question One
(a)Set out briefly (without substantial discussion) the principal determinants of the supply function for sea transport capacity.Which of these, and briefly why, would you see as the single most pivotal supply determinant?
(30 marks)
(b)(i)As part of an orderly process of fleet maintenance and renewal, ship owners may consider the potential disposal of certain of their vessels for demolition (scrapping). What are the main factors that may induce a ship owner to sell a vessel (or vessels) for scrap, and which of these would you identify as the most important influences over scrapping decisions? (I am looking for a fairly full discussion here.)(70 marks)
(ii)The cycle of deliveries of new vessels from global shipyards generally overruns both peaks and troughs in global sea trading activity, such that the number and tonnage of new ships arriving in the hands of ship owners often continues to increase even after sea trade activity slows down or falls. Why is this not a surprise? Would you expect scrapping activity to be equally slow in responding to changes in trading activity, and if not, why not?
(30 marks)
(c)How best would you attempt to measure the productivity or performance levels of cargo-carrying vessels in the world fleet?What major factors are likely to influence the potential (technical) productivity of vessels?Why might actual productivity diverge from maximum potential productivity over time?
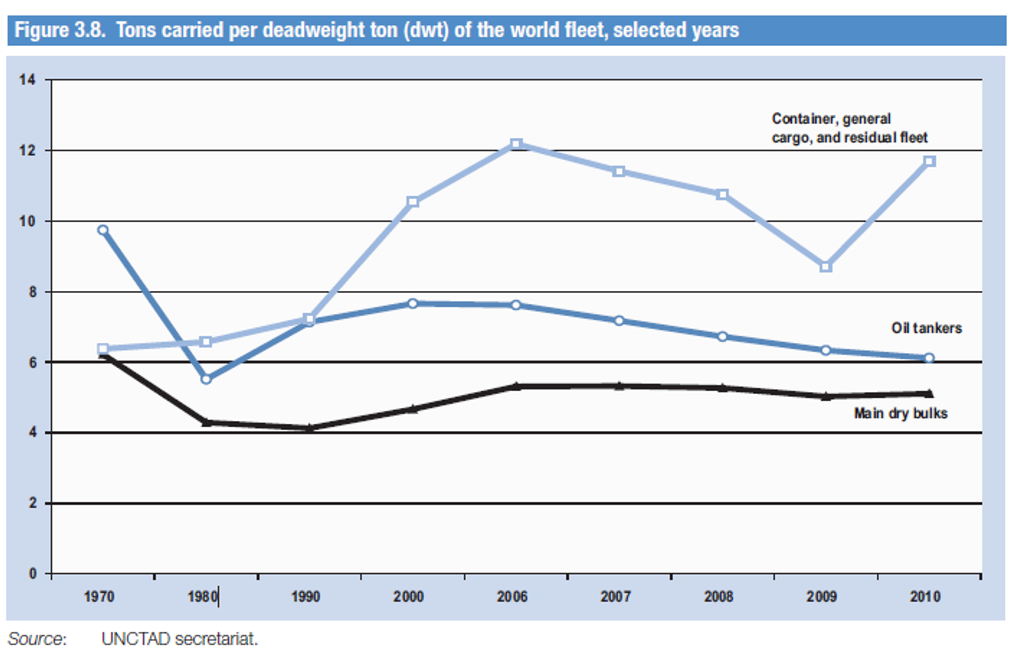
Consider the graphic below, which shows the performance of principal vessel types over time.Why, in your view, do general cargo/container vessels perform so much better than either dry-bulk carriers or oil tankers, as shown in the UNCTAD graphic?What accounts for the sharp decrease in container ship productivity in 2008/9, and its robust recovery thereafter?
(70 marks)

Step by Step Solution
There are 3 Steps involved in it
Step: 1

Get Instant Access to Expert-Tailored Solutions
See step-by-step solutions with expert insights and AI powered tools for academic success
Step: 2

Step: 3

Ace Your Homework with AI
Get the answers you need in no time with our AI-driven, step-by-step assistance
Get Started


