Question
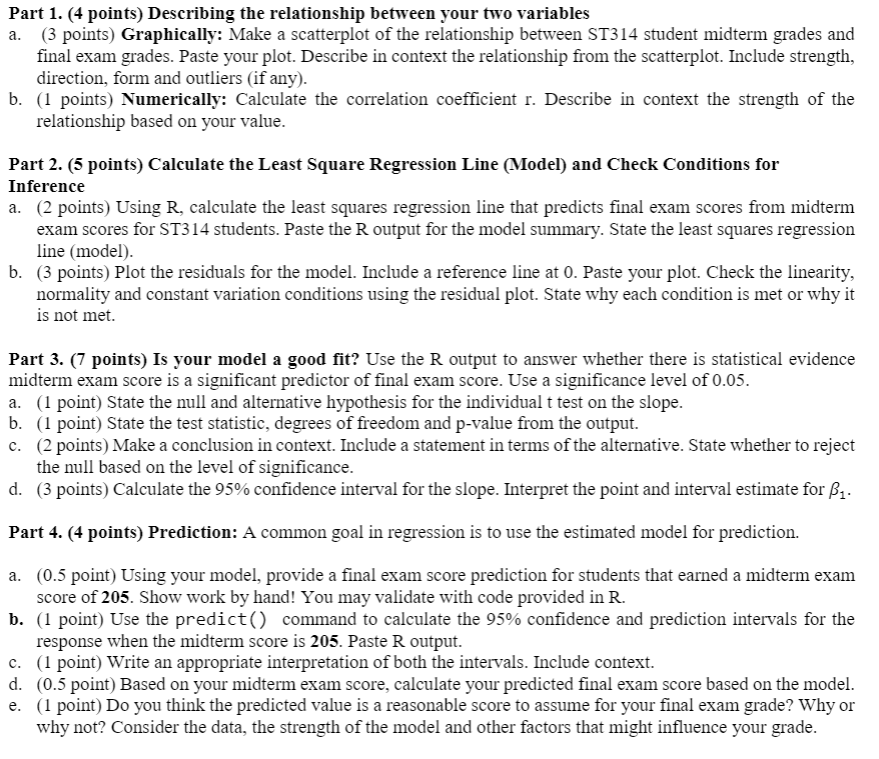
Part 1. (4 points) Describing the relationship between your two variables a. (3 points) Graphically: Make a scatterplot of the relationship between $1314 student midterm grades and nal exam grades. Paste your plot. Describe in context the relationship from the scatterplot. Include strength, direction, form and outliers (if any). h. (1 points} Numerically: Calculate the correlation coefcient r. Describe in context the strength of the relationship based on your value. Part 2. (5 points) Calculate the Least Square Regression Line Model) and Check Conditions for Inference a. (2 points] Using R, calculate the least squares regression line that predicts nal exam scores from midterm exam scores for ST314 students. Paste the R output for the model summary. State the least squares regression line (model). b. (3 points) Plot the residuals for the model. Include a reference line at 0. Paste your plot. Check the linearity, normality and constant variation conditions using the residual plot. State why each condition is met or why it is not met. Part 3. [7 points) Is your model a good t? Use the R output to answer whether there is statistical evidence midterm exam score is a signicant predictor of nal exam score. Use a signicance level of 0.05. a. (1 point) State the null and altemative hypothesis for the individual t test on the slope. b. (1 point) State the test statistic, degrees of 'eedom and p-value 'om the output. c. (2 points) Make a conclusion incontext. Include a statement in terms of the alternative. State whether to reject the null based on the level of significance. d. (3 points) Calculate the 95% condence interval for the slope. Interpret the point and interval estimate for 31. Part 4. (4 points) Prediction: A common goal in regression is to use the estimated model for prediction. a. (0.5 point] Using your model, provide a nal exam score prediction for students that earned a midterm exam score of 205. Show work by hand! You may validate with code provided in R. b. (1 point) Use the predictO command to calculate the 95% condence and prediction intervals for the response when the midterm score is 205. Paste R output. c. (1 point) Write an appropriate interpretation of both the intervals. Include context. d. (0.5 point) Based on your midterm exam score, calculate your predicted nal exam score based on the model. e. (1 point) Do you think the predicted value is a reasonable score to assume for your nal exam grade? Why or why not? Consider the data, the strength of the model and other factors that might inuence your grade


