Question
Question: Perform a sensitivity analysis on four parameters: Select four parameters from the list below and clearly explain why those parameters are important to analyze
Question: Perform a sensitivity analysis on four parameters: Select four parameters from the list below and clearly explain why those parameters are important to analyze for your company in the word document. The Worst and Best cases for each assumption are already provided. Do the sensitivity analysis in Excel and report your results in the word document (just the NPV results, unlike in the baseline analysis where you need to report your analysis in rows 3-57.)
Parameter
Sales in Year 1 (in thousands) Sales Growth through Year 6 Cost of Goods Sold (% of Sales) Cost of Capital
Accounts Receivable % of Next Year Sales
Initial Worst Case Assumption
$30,000 $27,000 6% 0% 72% 77% 20% 23% 15% 20%
Best Case
$33,000 10% 67% 17% 10%
Inventory % of Next Year COGS Accounts Payable % of Next Year COGS
Initial NWC (in thousands) Sales Growth After Year 6 Free Cash Flow Growth After Year 6 Initial Capital Expenditure (in thousands)
20% 25% 15% 15% 10% 20%
$6,000 $4,500 $7,500 2% 0% 4% 2% 0% 4% $9,000 $7,000 $11,000
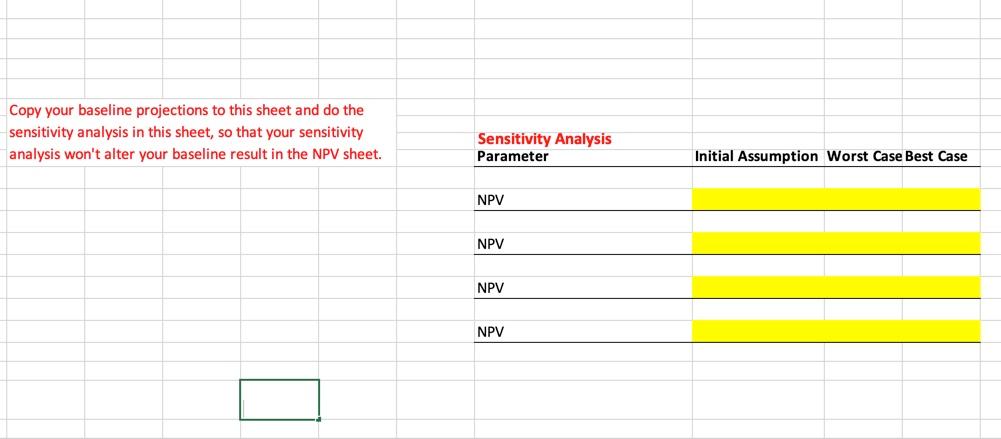
For example, vary the parameter Sales in Year 1 from the worst case ($27 million) to the best case ($33 million), holding all the other parameters fixed (at the level of initial assumptions). Then fill in the highlighted blank boxes for NPV in the sheet of Sensitivity Analysis.
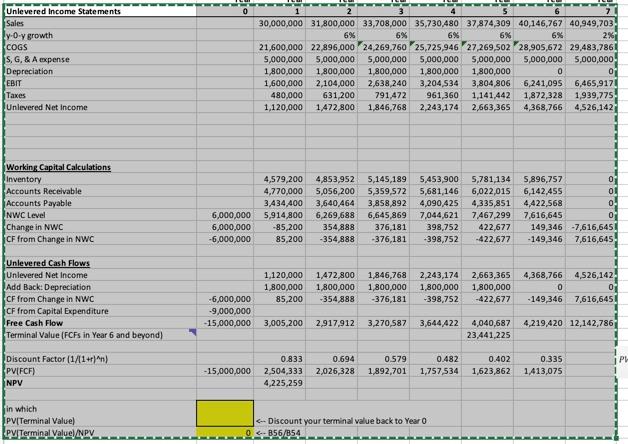
Unlevered Income Statements Sales |y-0-y growth COGS IS, G, & A expense Depreciation EBIT Taxes Unlevered Net Income 30,000,000 31,800,000 33,708,000 35,730,480 37,874,309 40,146,767 40,949,703 6% 6% 6% 6% 6% 2% 21,600,000 22,896,000 24,269,760 25,725,946 27,269,502 28,905,672 29,483,786 5,000,000 5,000,000 5,000,000 5,000,000 5,000,000 5,000,000 5,000,000 1,800,000 1.800,000 1,800,000 1,800,000 1,800,000 0 01 1,600,000 2,104,000 2,638 240 3,204,534 3,804,806 6,241,095 6,465,9171 480,000 631 200 791,472 961,360 1,141,442 1,872,328 1.939,775 1,120,000 1,472,800 1,846,768 2,243,174 2,663,365 4,368,766 4,526,1421 Working Capital Calculations Inventory Accounts Receivable Accounts Payable NWC Level Change in NWC CF from Change in NWC 4,579,200 4.770,000 3,434,400 5,914,800 -85,200 85,200 4,853,952 5,056,200 3,640,464 6,269,688 354,888 -354,888 5,145,189 5,359,572 3,858,892 6,645,869 376,181 -376,181 5,453,900 5,681,146 4,090,425 7,044,621 398,752 -398,752 5,781,134 6,022,015 4,335,851 7,467,299 422,677 -422,677 5,896,757 0 6,142,455 01 4,422,568 0 7,616,645 0 149,346 -7,616,645! -149,346 7,616,645 6,000,000 6,000,000 -6,000,000 Unlevered Cash Flows Unlevered Net Income Add Back: Depreciation CF from Change in NWC CF from Capital Expenditure Free Cash Flow Terminal Value (FCFS in Year 6 and beyond) 1,120,000 1,800,000 85,200 1,472,800 1,800,000 -354 888 1.846,768 1,800,000 -376,181 2,243,174 1,800,000 -398,752 2,663,365 1,800,000 -422,677 4,368,766 0 - 149,346 4,526,142 01 7,616,645! -6,000,000 -9,000,000 -15,000,000 3,005,200 2,917,912 3,270,587 3,644422 4,219,420 12,142,786 4,040,687 23,441,225 Discount Factor (1/(1+r)^n) PVIFCF) NPV PL- 0.833 2,504,333 4,225,259 0.579 1,892,701 0.694 2,026,328 0.482 1,757,534 0.402 1,623,862 -15,000,000 0.335 1413,075 in which PV[Terminal Valuel LP Terminal Valuel/NPYStep by Step Solution
There are 3 Steps involved in it
Step: 1
Get Instant Access to Expert-Tailored Solutions
See step-by-step solutions with expert insights and AI powered tools for academic success
Step: 2
Step: 3
Ace Your Homework with AI
Get the answers you need in no time with our AI-driven, step-by-step assistance
Get Started