Answered step by step
Verified Expert Solution
Link Copied!

Question

1 Approved Answer

Question: Please answer the following question clearly, thank you. 1. Quarterly party bookings at Terrace Events been recorded as follows. a) Compute the seasonal quarterly

Question:

Please answer the following question clearly, thank you.

1. Quarterly party bookings at Terrace Events been recorded as follows.

a) Compute the seasonal quarterly indexes given the regression line: y = 3 + 4t YEAR Quarter t Yt y Ratio Quarters

2019 1 4

2 7

3 14

4 8

2020 1 5

2 3

3 10

4 6

b) Use the seasonal quarterly index to de-seasonalize the time series.

YEAR Quarter t Yt SQL Seasonally adjusted time series

2019 1

2

3

4

2020 1

2

3

4

c) Use the regression line: y= 3 + 4t and the seasonal quarterly indexes to forecast Terrace Events' party bookings for all quarters of 2021.

YEAR Quarter t y SQL Forecast

2021 1

2

3

4
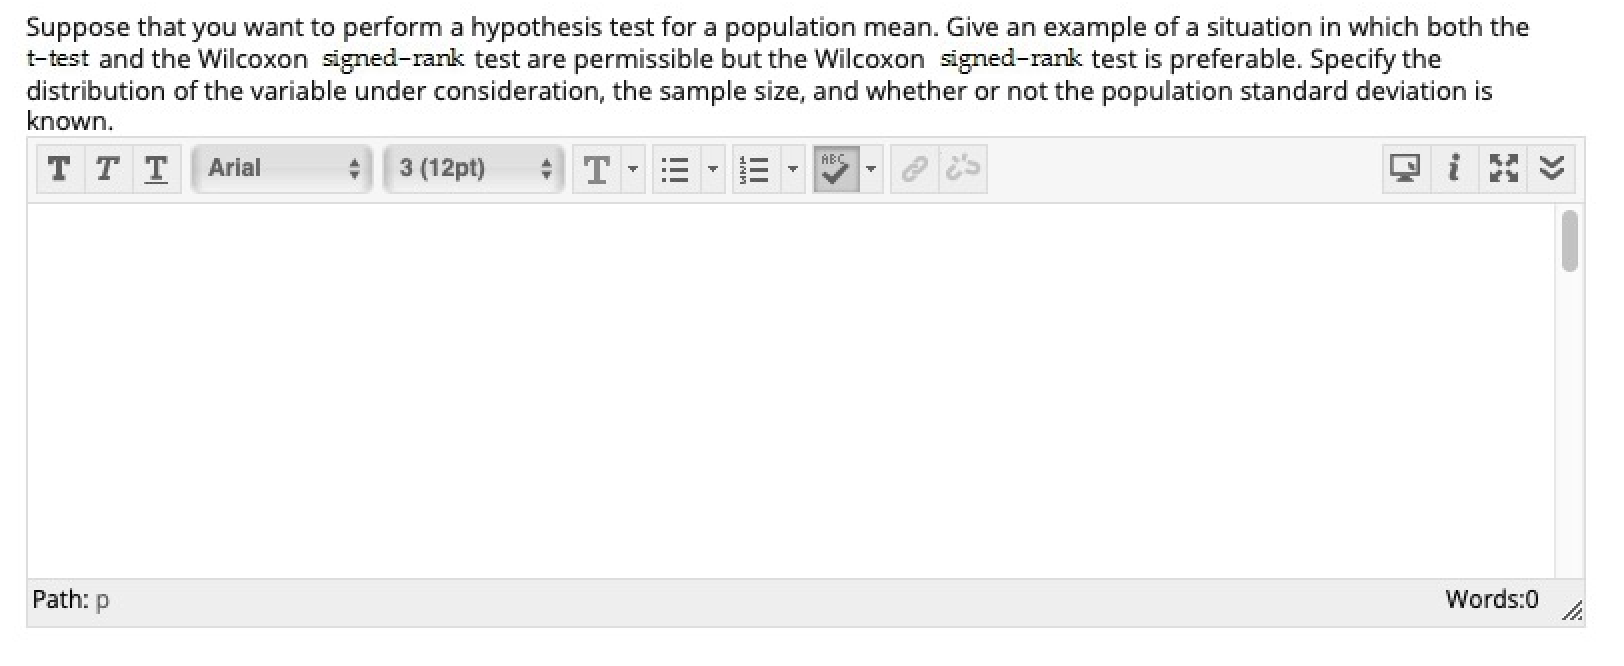
image text in transcribedimage text in transcribedimage text in transcribedimage text in transcribed
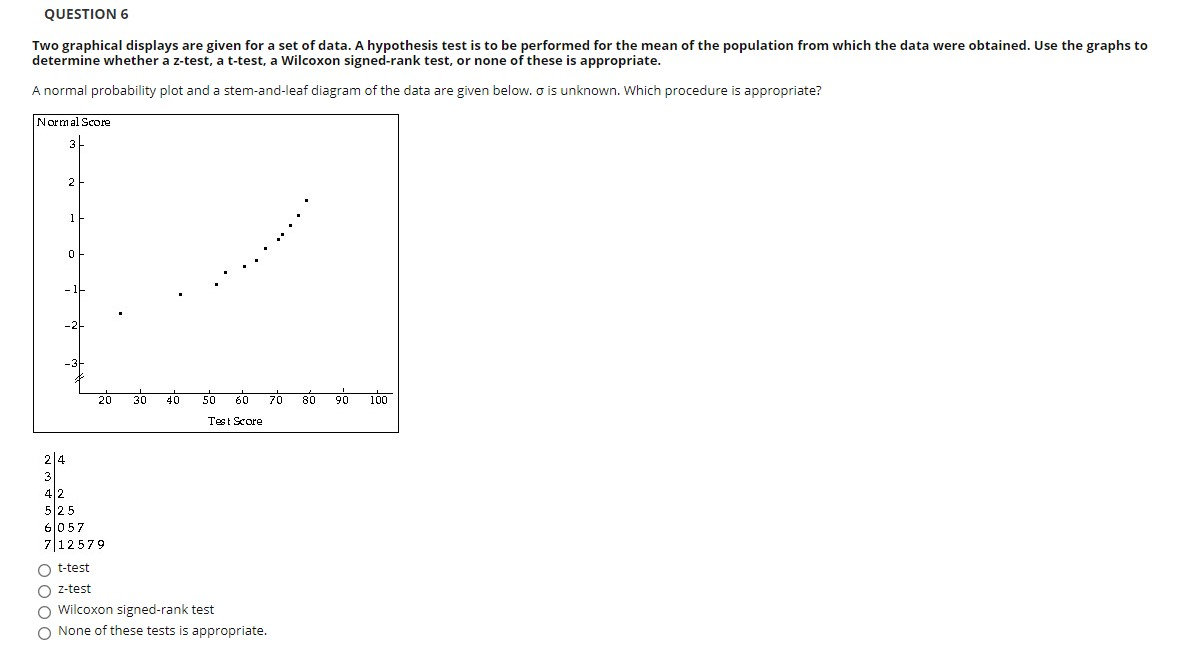
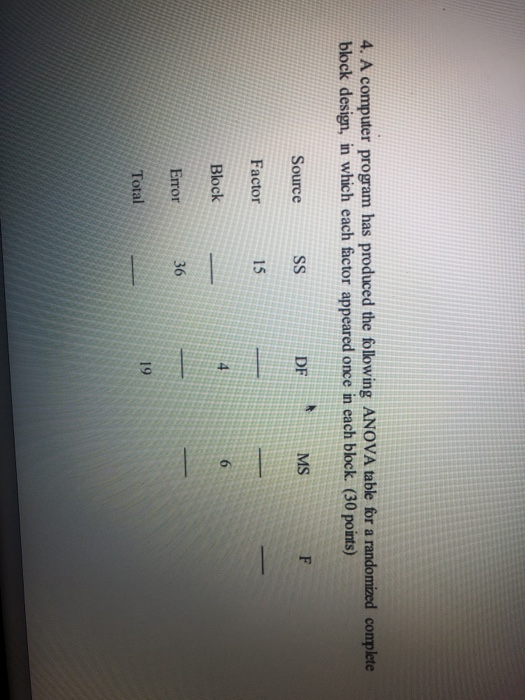
Suppose that you want to perform a hypothesis test for a population mean. Give an example of a situation in which both the t-test and the Wilcoxon signed-rank test are permissible but the Wilcoxon signed-rank test is preferable. Specify the distribution of the variable under consideration, the sample size, and whether or not the population standard deviation is known. TTT Arial 3 (12pt) T MNK Path: p Words:0 AQUESTION 6 Two graphical displays are given for a set of data. A hypothesis test is to be performed for the mean of the population from which the data were obtained. Use the graphs to determine whether a z-test, a t-test, a Wilcoxon signed-rank test, or none of these is appropriate. A normal probability plot and a stem-and-leaf diagram of the data are given below. o is unknown. Which procedure is appropriate? Normal Score 3 21 1 - 1 -21 -3- 20 30 40 50 60 70 80 90 100 Test Score 24 3 4 2 5 25 6 057 7 12579 O t-test O O Wilcoxon signed-rank test O None of these tests is appropriate.4. A computer program has produced the following ANOVA table for a randomized complete block design, in which each factor appeared once in each block. (30 points) Source Factor Block Error Total(b) Find bounds on the p-value. (6 points)

Step by Step Solution

There are 3 Steps involved in it

Step: 1

blur-text-image

Get Instant Access to Expert-Tailored Solutions

See step-by-step solutions with expert insights and AI powered tools for academic success

Step: 2

blur-text-image

Step: 3

blur-text-image

Ace Your Homework with AI

Get the answers you need in no time with our AI-driven, step-by-step assistance

Get Started

Recommended Textbook for

More Books

Students also viewed these Mathematics questions

Question

U11 Informing Industry: Publicizing Contract Actions 317

Answered: 1 week ago