Question:
Scientists are interested in predicting the cancer volume (in mm3) from a blood marker measurement for patients who are known to have prostate cancer. The file prostate.csv contain the blood marker measurement and cancer volume for 200 prostate cancer pa- tients.
(a) Identify the independent and dependent variable in this experiment.
(b) Load the dataset into Python and ppropriate graphical summary of the data. Describe the plot.
(c) Compute the correlation coefficient between the cancer volume and the blood marker measurement. Does this indicate a strong or weak linear relationship? Is the rela- tionship positive or negative?
(d) Fit a linear regression model to the data. Describe the fitted relationship.
(e) A new prostate cancer patient arrive at the clinic with a blood marker measurement
of 4.3 mm3. Use the fitted model to predict the cancer volume for this patient.
(f) Examine the model residuals to determine if the assumptions about the random
component of the linear regression model are met.
(g) After reviewing the data, the scientists realise that their equipment is inaccurate for blood marker measurements below 1. As such, patients with a blood marker measurement of less than 1 must be removed from the analysis. Remove these patients from the dataset and analysis. Does this improve the model fit? Explain your reasoning.
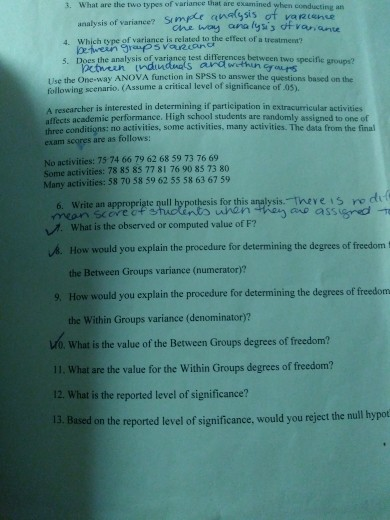
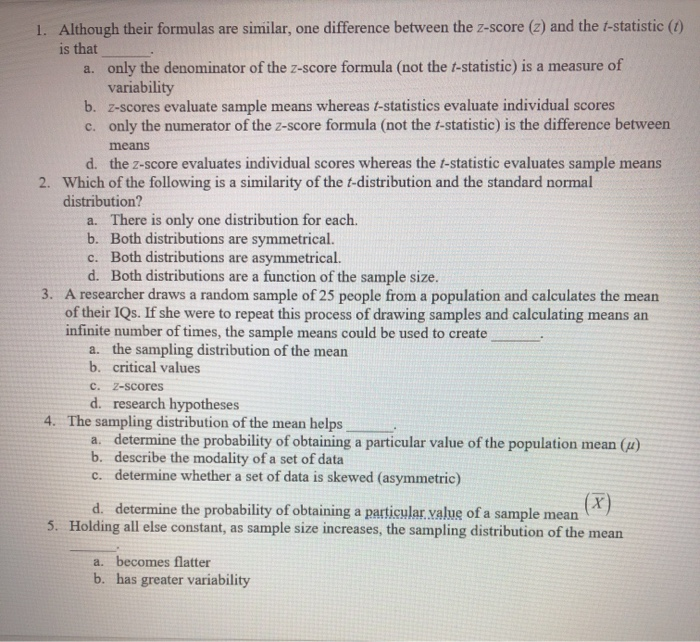
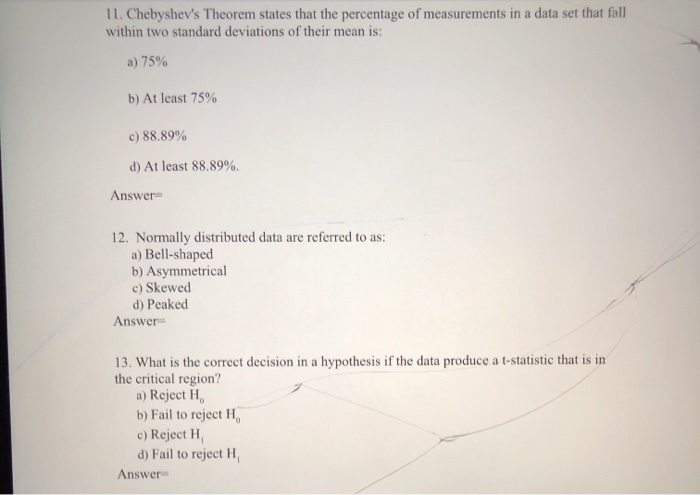
3. What are the two types of variance that are examined when conducting an analysis of variance? Simple analysis of vaptanwe the way analysis of rananu 4. Which type of variance is related to the effect of a treatmem" 5. Does the analysis of variance test differences between two specific groups? Use the One-way ANDVA function in SPSS to answer the questions based on the following scenario. (Assume a critical level of significance of 05). A researcher is interested in determining if participation in extracurricular activities affects academic performance. High school students are randomly assigned to one of three conditions; no activities, some activities, many activities. The data from the final exam scores are as follows: No activities: 75 74 66 79 62 68 59 73 76 69 Some activities: 78 85 85 77 81 76 90 85 73 80 Many activities: 58 70 58 59 62 55 58 63 67 59 6. Write an appropriate null hypothesis for this analysis. There is rodul mean score of students when they a assigned To 7. What is the observed or computed value of F? 8. How would you explain the procedure for determining the degrees of freedom the Between Groups variance (numerator)? 9, How would you explain the procedure for determining the degrees of freedom the Within Groups variance (denominator)? Wo. What is the value of the Between Groups degrees of freedom? 11. What are the value for the Within Groups degrees of freedom? 12. What is the reported level of significance? 13. Based on the reported level of significance. would you reject the null hypo1. Although their formulas are similar, one difference between the z-score (z) and the f-statistic () is that a. only the denominator of the z-score formula (not the f-statistic) is a measure of variability b. z-scores evaluate sample means whereas /-statistics evaluate individual scores c. only the numerator of the z-score formula (not the t-statistic) is the difference between means d. the z-score evaluates individual scores whereas the /-statistic evaluates sample means 2. Which of the following is a similarity of the f-distribution and the standard normal distribution? a. There is only one distribution for each. b. Both distributions are symmetrical. c. Both distributions are asymmetrical. d. Both distributions are a function of the sample size. 3. A researcher draws a random sample of 25 people from a population and calculates the mean of their IQs. If she were to repeat this process of drawing samples and calculating means an infinite number of times, the sample means could be used to create a. the sampling distribution of the mean b. critical values c. Z-scores d. research hypotheses 4. The sampling distribution of the mean helps a. determine the probability of obtaining a particular value of the population mean (u) b. describe the modality of a set of data c. determine whether a set of data is skewed (asymmetric) d. determine the probability of obtaining a particular value of a sample mean ( X ) 5. Holding all else constant, as sample size increases, the sampling distribution of the mean a. becomes flatter b. has greater variability11. Chebyshev's Theorem states that the percentage of measurements in a data set that fall within two standard deviations of their mean is: a) 75% b) At least 75% c) 88.89% d) At least 88.89%. Answer 12. Normally distributed data are referred to as: a) Bell-shaped b) Asymmetrical c) Skewed d) Peaked Answer 13. What is the correct decision in a hypothesis if the data produce a t-statistic that is in the critical region? a) Reject H. b) Fail to reject H c) Reject H d) Fail to reject H Answer200 150 X Liq 100 Lig + X Temperature, 'C 50 W 0 Ice+Lig L+ X.W 2 Ice + X.W. X.W2 + X 2 -50 20 40 60 80 100 Percent Sodium ChlorideThe moment-generating function for a random variable having a Poisson distribution with parameter A is ME!) = en} [Her 1)). If 1! is the mean of a random sample of size n from a Poisson distribution with parameter .1, than which of the following statements is true? G) E has a normal distribution with mean A and variance ,1 E has a normal distribution with mean .1 and variance % G E has a Poisson distribution with parameter ,1 Q n} has a Poisson distribution with parameter .1" G n} has a Poisson distribution we parameter ni