Question:
Scientists are interested in predicting the cancer volume (in mm3) from a blood marker measurement for patients who are known to have prostate cancer. The file prostate.csv contain the blood marker measurement and cancer volume for 200 prostate cancer pa- tients.?
?
(a) Identify the independent and dependent variable in this experiment.?
?
(b) Load the dataset into Python and create an appropriate graphical summary of the data. Describe the plot.?
?
(c) Compute the correlation coefficient between the cancer volume and the blood marker measurement. Does this indicate a strong or weak linear relationship? Is the rela- tionship positive or negative??
?
(d) Fit a linear regression model to the data. Describe the fitted relationship.?
?
(e) A new prostate cancer patient arrive at the clinic with a blood marker measurement?
?
of 4.3 mm3. Use the fitted model to predict the cancer volume for this patient.?
?
(f) Examine the model residuals to determine if the assumptions about the random?
?
component of the linear regression model are met.?
?
(g) After reviewing the data, the scientists realise that their equipment is inaccurate for blood marker measurements below 1. As such, patients with a blood marker measurement of less than 1 must be removed from the analysis. Remove these patients from the dataset and redo your analysis. Does this improve the model fit? Explain your reasoning.?
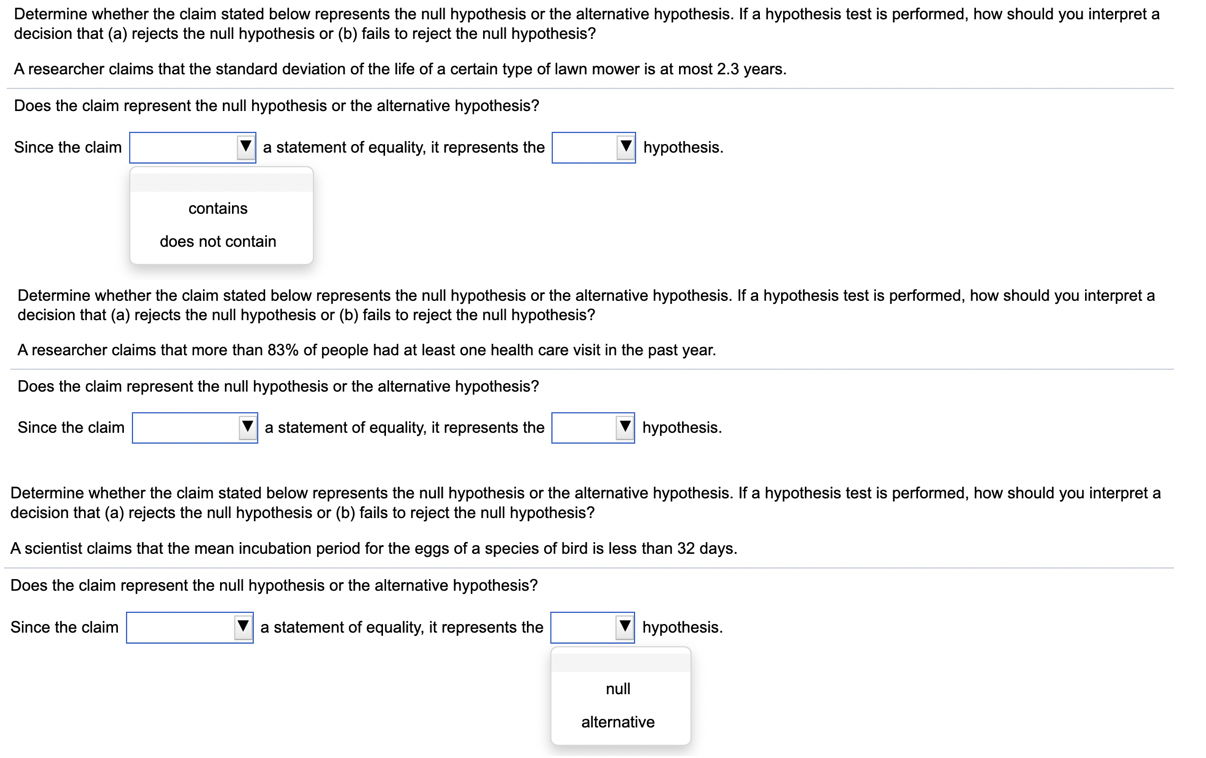
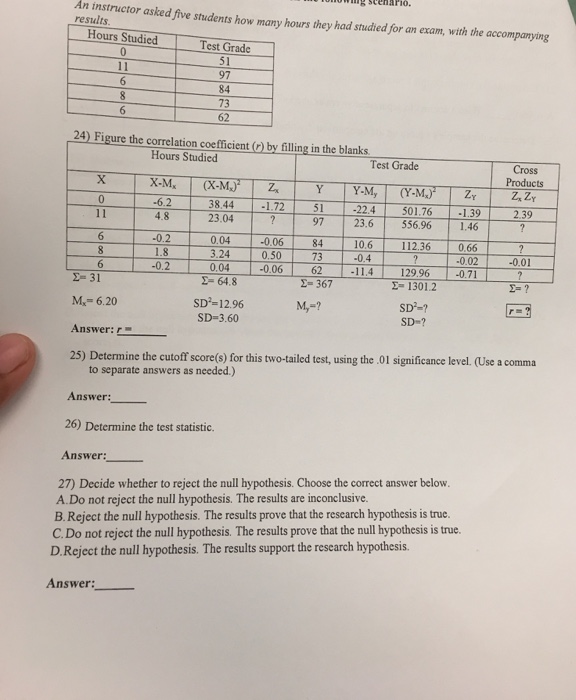
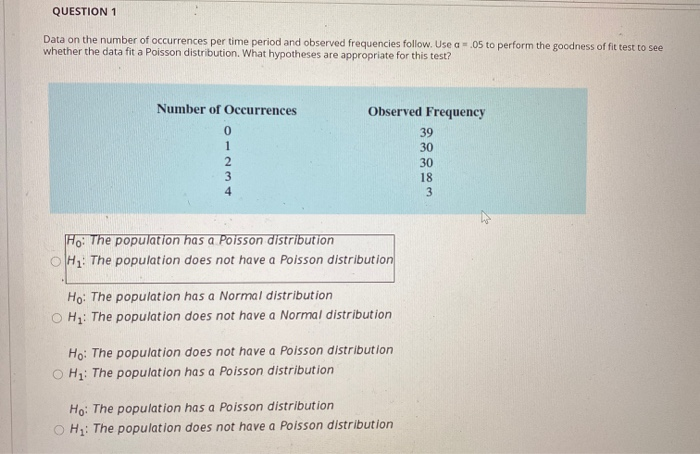
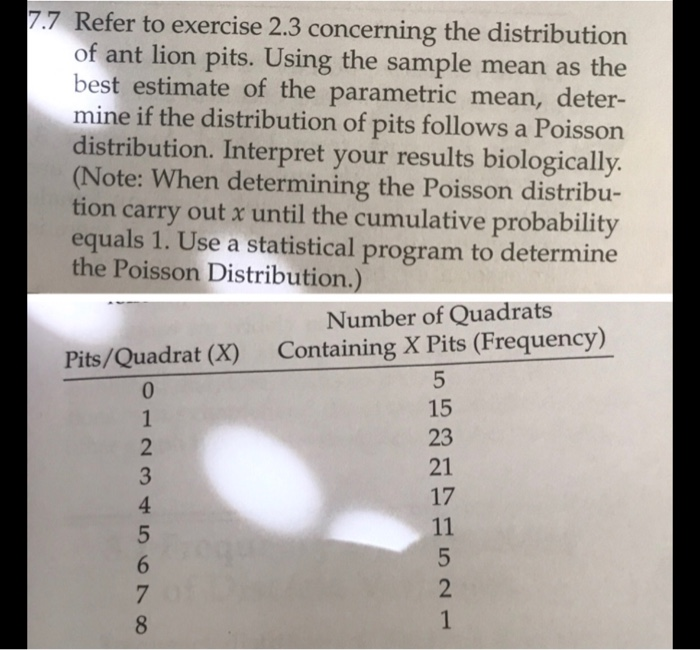
Determine whether the claim stated below represents the null hypothesis or the alternative hypothesis. If a hypothesis test is performed. how should you interpret a decision that (a) rejects the null hypothesis or (b) fails to reject the null hypothesis? A researcher claims that the standard deviation of the lite of a certain type of lawn mower is at most 2.3 years. Does the claim represent the null hypothesis or the alternative hypothesis? Since the claim '2 a statement of equality, it represents the I: hypothesis. contains does not contain Determine whether the claim stated below represents the null hypothesis or the altematiye hypothesis. Ifa hypothesis testis performed, how should you interpret a decision that (a) rejects the null hypothesis or (b) fails to reject the null hypolhesis? A researcher claims that more than 33% of people had at least one health care visit in the past year. Does the claim represent the null hypothesis or the alternative hypothesis? Since the claim E a statement of equality. it represents the I: hypothesis. Determine whether the claim stated below represents the null hypothesis or the altematiye hypothesis. If a hypothesis test is performed. how should you interpret a decision that {a} rejects the null hypothesis or (b) fails to reject the null hypothesis? A scientist claims that the mean incubation period for the eggs of a species 01 bird is less than 32 days. Does the claim represent the null hypothesis or the alternative hypothesis? Since the claim E a statement ofequality, it represents the l: hypothesis. null alternative results An instructor asked five students how many hours they had studied for an exam, with the accompanying Hours Studied Test Grade 11 51 97 6 8 84 73 62 24) Figure the correlation coefficient (r) by filling in the blanks. Hours Studied Test Grade Cross X X-M. Products (X-M.) Y Y-My (Y-M.) ZY Z. ZY 0 -6.2 38.44 -1.72 51 11 -22.4 501.76 4.8 -1.39 2 39 23.04 97 23.6 556.96 1.46 6 -0.2 0.04 -0.06 84 10.6 112.36 0.66 ? 1.8 3.24 0.50 73 -0.4 -0.02 -0.0 6 -0.2 0.04 -0.06 62 -11.4 129.96 -0.71 7 E= 31 E= 64.8 E-367 2- 1301.2 My = 6.20 SD-=12.96 M,=? SD -? SD=3.60 SD-? Answer: r= 25) Determine the cutoff score(s) for this two-tailed test, using the .01 significance level. (Use a comma to separate answers as needed.) Answer: 26) Determine the test statistic. Answer: 27) Decide whether to reject the null hypothesis. Choose the correct answer below. A. Do not reject the null hypothesis. The results are inconclusive. B. Reject the null hypothesis. The results prove that the research hypothesis is true. C. Do not reject the null hypothesis. The results prove that the null hypothesis is true. D. Reject the null hypothesis. The results support the research hypothesis. Answer:QUESTION 1 Data on the number of occurrences per time period and observed frequencies follow. Use a = .05 to perform the goodness of fit test to see whether the data fit a Poisson distribution. What hypotheses are appropriate for this test? Number of Occurrences Observed Frequency 39 30 AWNO 30 18 3 Ho: The population has a Poisson distribution O H1: The population does not have a Poisson distribution Ho: The population has a Normal distribution O H1: The population does not have a Normal distribution Ho: The population does not have a Poisson distribution O H1: The population has a Poisson distribution Ho: The population has a Poisson distribution O H1: The population does not have a Poisson distribution7.7 Refer to exercise 2.3 concerning the distribution of ant lion pits. Using the sample mean as the best estimate of the parametric mean, deter- mine if the distribution of pits follows a Poisson distribution. Interpret your results biologically. (Note: When determining the Poisson distribu- tion carry out x until the cumulative probability equals 1. Use a statistical program to determine the Poisson Distribution.) Number of Quadrats Pits/Quadrat (X) Containing X Pits (Frequency) 5 15 23 DO YOUTAWNHO
