Answered step by step
Verified Expert Solution
Question
1 Approved Answer
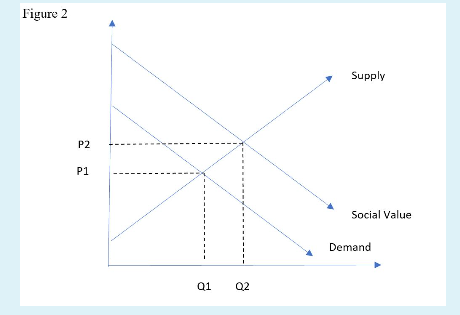
Question text Use the following figure to determine market equilibrium, social optimum, and whether the graph represents a negative externality or positive externality: In the
Question text
Use the following figure to determine market equilibrium, social optimum, and whether the graph represents a negative externality or positive externality:
In the essay box below, answer the following two questions. Please make sure to number your answers.
4. Refer to Figure 2. The market equilibrium quantity is
5. Does this represent a positive externality or negative externality and why?

Step by Step Solution
There are 3 Steps involved in it
Step: 1

Get Instant Access to Expert-Tailored Solutions
See step-by-step solutions with expert insights and AI powered tools for academic success
Step: 2

Step: 3

Ace Your Homework with AI
Get the answers you need in no time with our AI-driven, step-by-step assistance
Get Started


