Answered step by step
Verified Expert Solution
Link Copied!

Question

1 Approved Answer

Question The income statements and balance sheets for year I and year 2 for Lucky Corporation (S millions) are as follows: Lucky Corporation Year 2
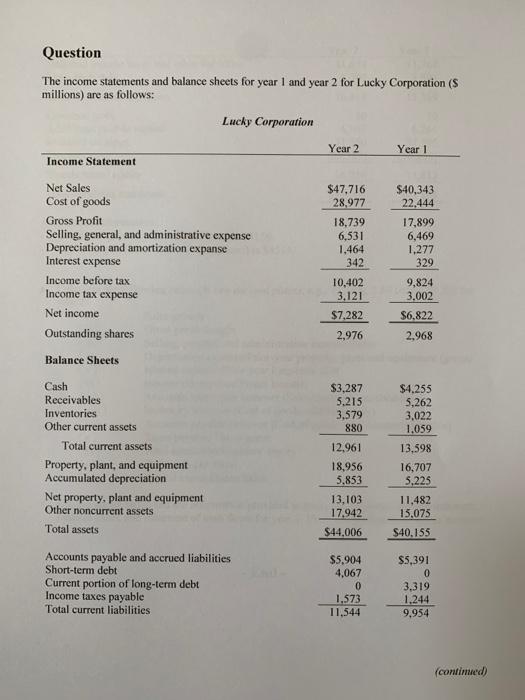
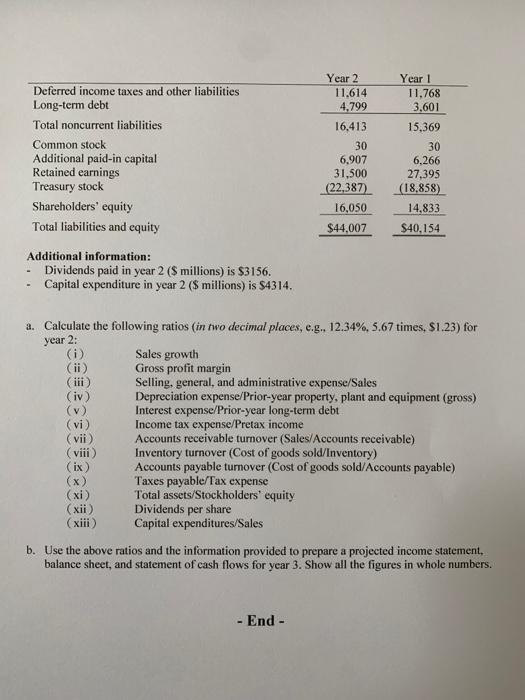
image text in transcribed
Question The income statements and balance sheets for year I and year 2 for Lucky Corporation (S millions) are as follows: Lucky Corporation Year 2 Year 1 Income Statement $40,343 22.444 Net Sales Cost of goods Gross Profit Selling, general, and administrative expense Depreciation and amortization expanse Interest expense Income before tax Income tax expense Net income Outstanding shares $47,716 28,977 18,739 6,531 1,464 342 17,899 6,469 1.277 329 10,402 3,121 $7,282 9,824 3.002 $6,822 2,976 2.968 Balance Sheets $3,287 5.215 3.579 880 Cash Receivables Inventories Other current assets Total current assets Property, plant, and equipment Accumulated depreciation Net property, plant and equipment Other noncurrent assets Total assets $4.255 5,262 3,022 1,059 13,598 16,707 5,225 12.961 18,956 5.853 13.103 17.942 $44,006 11.482 15.075 $40.155 Accounts payable and accrued liabilities Short-term debt Current portion of long-term debt Income taxes payable Total current liabilities $5.904 4,067 0 1.573 11.544 $5,391 0 3,319 1.244 9,954 (continued Deferred income taxes and other liabilities Long-term debt Total noncurrent liabilities Common stock Additional paid-in capital Retained earnings Treasury stock Shareholders' equity Total liabilities and equity Year 2 11.614 4.799 16,413 30 6.907 31,500 (22,387) 16,050 $44.007 Year 1 11.768 3.601 15,369 30 6,266 27,395 (18,858) 14,833 $40,154 Additional information: Dividends paid in year 2 ($ millions) is $3156. Capital expenditure in year 2 ($ millions) is $4314. year 2: a. Calculate the following ratios (in two decimal places, e.g., 12.34%, 5.67 times, $1.23) for (i) Sales growth (ii) Gross profit margin (iii) Selling, general, and administrative expense/Sales (iv) Depreciation expense/Prior-year property, plant and equipment (gross) (v) Interest expense/Prior-year long-term debt (vi) Income tax expense/Pretax income (vii) Accounts receivable turnover (Sales/Accounts receivable) (viii) Inventory turnover (Cost of goods sold/Inventory) (ix) Accounts payable turnover (Cost of goods sold/Accounts payable) (x) Taxes payable/Tax expense (xi) Total assets/Stockholders' equity (xii) Dividends per share (xiii) Capital expenditures/Sales b. Use the above ratios and the information provided to prepare a projected income statement, balance sheet, and statement of cash flows for year 3. Show all the figures in whole numbers. End

Step by Step Solution

There are 3 Steps involved in it

Step: 1

blur-text-image

Get Instant Access to Expert-Tailored Solutions

See step-by-step solutions with expert insights and AI powered tools for academic success

Step: 2

blur-text-image_2

Step: 3

blur-text-image_3

Ace Your Homework with AI

Get the answers you need in no time with our AI-driven, step-by-step assistance

Get Started

Recommended Textbook for

Day Trading Cardinal Rules For Passive Income

Authors: Brian Stclair

1st Edition

1539480313, 978-1539480310

More Books

Students also viewed these Finance questions

Question

Which of the following formulas is correct regarding productivity

Answered: 1 week ago