

Question
Question: The rate at which snow falls and melts at a point on a glacier , in feet per month, is shown in the graph
Question: The rate at which snow falls and melts at a point on a glacier  , in feet per month, is shown in the graph below:
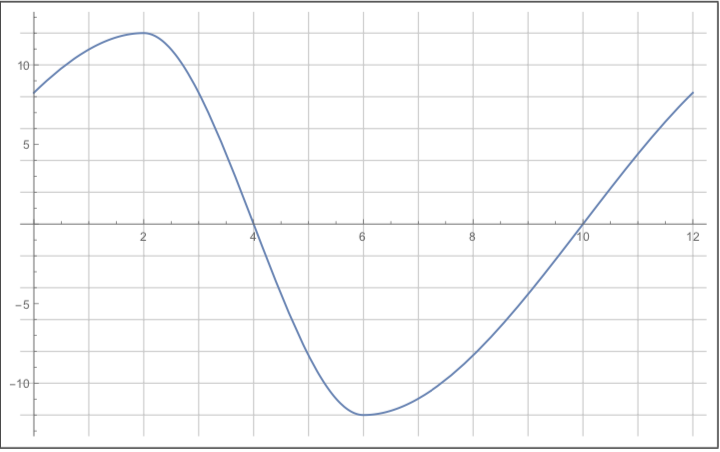
(a) If the glacier is 100 ft deep at the beginning of the year, use the area between the graph and the x-axis to make a table estimating the depth of the snow for 
(b) If the depth of the snow 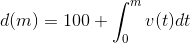 , use the graph to give the location of any local maxima or minima for the function
  .
.
(c) Use the graph to give the locations of any points of inflection for  .
.
(d) Use the information from parts (a), (b), and (c) to sketch a graph of the function  below.
Thank you so much and stay safe!!
Transcribed image textStep by Step Solution
There are 3 Steps involved in it
Step: 1

Get Instant Access to Expert-Tailored Solutions
See step-by-step solutions with expert insights and AI powered tools for academic success
Step: 2

Step: 3
Ace Your Homework with AI
Get the answers you need in no time with our AI-driven, step-by-step assistance
Get Started
Essentials Of Xbrl Financial Reporting In The 21st Century
Authors: Bryan Bergeron
1st Edition
0471220779, 978-0471220770