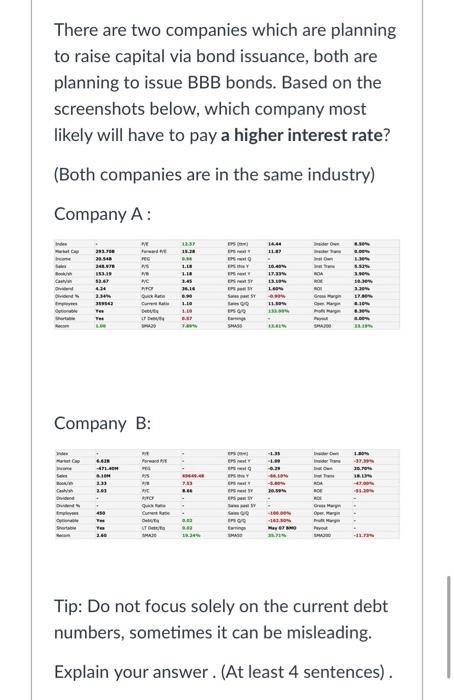
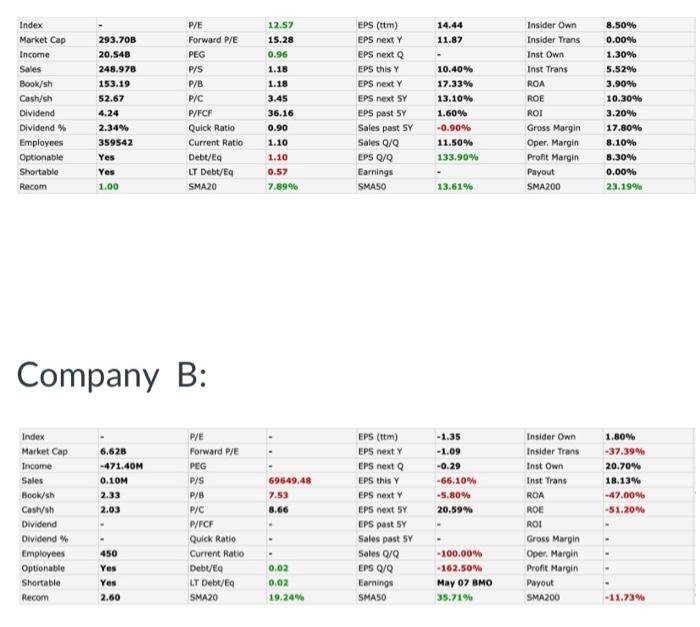
Question: There are two companies which are planning to raise capital via bond issuance, both are planning to issue BBB bonds. Based on the screenshots below, which company most likely will have to pay a higher interest rate?
(Both companies are in the same industry)
Tip: Do not focus solely on the current debt numbers, sometimes it can be misleading.
Explain your answer . (At least 4 sentences) .
There are two companies which are planning to raise capital via bond issuance, both are planning to issue BBB bonds. Based on the screenshots below, which company most likely will have to pay a higher interest rate? (Both companies are in the same industry) Company A: 23 11.11 118) 2.54 G ES EASY 1.18 34. 3. 2. | S. 13.94 | 424 MO 16 3.10 2.3 Qui. Gr. 1952 I 10 Bole To UT . SHA Company B: Forward 123 . 2.- 20:34 ARCH IPS D W Current Sum 3.3 10.10 - 10.30 Tip: Do not focus solely on the current debt numbers, sometimes it can be misleading. Explain your answer. (At least 4 sentences). Index P/E 12.57 14.44 Insider Own 8.50% Market Cap 293.70B Forward P/E 15.28 11.87 Insider Trans 0.00% EPS (ttm) EPS next Y EPS next EPS this Y Income 20.548 PEG 0.96 Inst Own 1.30% Sales 248.978 P/S 1.18 10.40% Inst Trans 5.52% Book/sh 153.19 P/B 1.18 EPS next Y 17.33% ROA 3.90% Cash/sh 52.67 P/C 3.45 EPS next 5 13.10% ROE 10.30% Dividend 4.24 P/FCF 36.16 1.60% ROI 3.20% Dividend % 2.34% Quick Ratio 0.90 -0.90% 17.80% Employees 359542 Current Ratio 1.10 EPS past 5Y Sales past SY Sales Q/Q EPS 0/0 Earnings 11.50% 8.10% Gross Margin Oper, Margin Profit Margin Payout Optionable Yes Debug 1.10 133.90% 8.30% Shortable Yes 0.57 0.00% LT Debt/Eq SMA20 Recom 1.00 7.89% SMASO 13.61% SMA200 23.19% Company B: Index PE EPS (tm) -1.35 Insider Own 1.80% Market Cap 6.628 Forward P/E EPS next Y -1.09 Insider Trans -37.39% Income -471.40M PEG EPS next -0.29 Inst Own 20.70% Sales 0.10M P/S 69649.48 EPS this Y -66.10% Inst Trans 18.13% Book/sh 2.33 P/B 7.53 EPS next Y -5.80% ROA - 47.009 -51.209 Costvah 2.03 P/C 8.66 EPS next 5Y 20.59% ROE Dividend EPS past SY ROI P/FCF Quick Ratio Dividende Employees 450 Current Ratio -100.00% Sales pasty Sales Q/Q EPS 0/0 Earnings Optionable Yes Debt/Eq 0.02 -162.50% Gross Margin Oper. Margin Profit Margin Payout SMA200 Shortable Yes LT Debt/E 0.02 May 07 BMO Recom 2.60 SMA20 19.24% SMASO 35.71% -11.73% There are two companies which are planning to raise capital via bond issuance, both are planning to issue BBB bonds. Based on the screenshots below, which company most likely will have to pay a higher interest rate? (Both companies are in the same industry) Company A: 23 11.11 118) 2.54 G ES EASY 1.18 34. 3. 2. | S. 13.94 | 424 MO 16 3.10 2.3 Qui. Gr. 1952 I 10 Bole To UT . SHA Company B: Forward 123 . 2.- 20:34 ARCH IPS D W Current Sum 3.3 10.10 - 10.30 Tip: Do not focus solely on the current debt numbers, sometimes it can be misleading. Explain your answer. (At least 4 sentences). Index P/E 12.57 14.44 Insider Own 8.50% Market Cap 293.70B Forward P/E 15.28 11.87 Insider Trans 0.00% EPS (ttm) EPS next Y EPS next EPS this Y Income 20.548 PEG 0.96 Inst Own 1.30% Sales 248.978 P/S 1.18 10.40% Inst Trans 5.52% Book/sh 153.19 P/B 1.18 EPS next Y 17.33% ROA 3.90% Cash/sh 52.67 P/C 3.45 EPS next 5 13.10% ROE 10.30% Dividend 4.24 P/FCF 36.16 1.60% ROI 3.20% Dividend % 2.34% Quick Ratio 0.90 -0.90% 17.80% Employees 359542 Current Ratio 1.10 EPS past 5Y Sales past SY Sales Q/Q EPS 0/0 Earnings 11.50% 8.10% Gross Margin Oper, Margin Profit Margin Payout Optionable Yes Debug 1.10 133.90% 8.30% Shortable Yes 0.57 0.00% LT Debt/Eq SMA20 Recom 1.00 7.89% SMASO 13.61% SMA200 23.19% Company B: Index PE EPS (tm) -1.35 Insider Own 1.80% Market Cap 6.628 Forward P/E EPS next Y -1.09 Insider Trans -37.39% Income -471.40M PEG EPS next -0.29 Inst Own 20.70% Sales 0.10M P/S 69649.48 EPS this Y -66.10% Inst Trans 18.13% Book/sh 2.33 P/B 7.53 EPS next Y -5.80% ROA - 47.009 -51.209 Costvah 2.03 P/C 8.66 EPS next 5Y 20.59% ROE Dividend EPS past SY ROI P/FCF Quick Ratio Dividende Employees 450 Current Ratio -100.00% Sales pasty Sales Q/Q EPS 0/0 Earnings Optionable Yes Debt/Eq 0.02 -162.50% Gross Margin Oper. Margin Profit Margin Payout SMA200 Shortable Yes LT Debt/E 0.02 May 07 BMO Recom 2.60 SMA20 19.24% SMASO 35.71% -11.73%


