Question:
"To what extent does gender influence the length of hospital stays for MI patients?"
Data Analysis
A. Graphs: In this section, you will use graphical displays to examine the data.
1. Create least one graph that gives a sense of the potential relationship between the two variables that form your chosen health question. Include the graph and discuss why you selected it as opposed to others.
B. Conduct an appropriate statistical test to answer your health question.
C. Explain why this test is the best choice in this context.
D. Analysis of Biostatistics: Use this section to describe your findings from a statistical standpoint. Be sure to:
1. Present key biostatistics from the graph(s) and statistical test and explain what they mean. Be sure to include a spreadsheet showing your work or a copy of your StatCrunch output as an appendix.
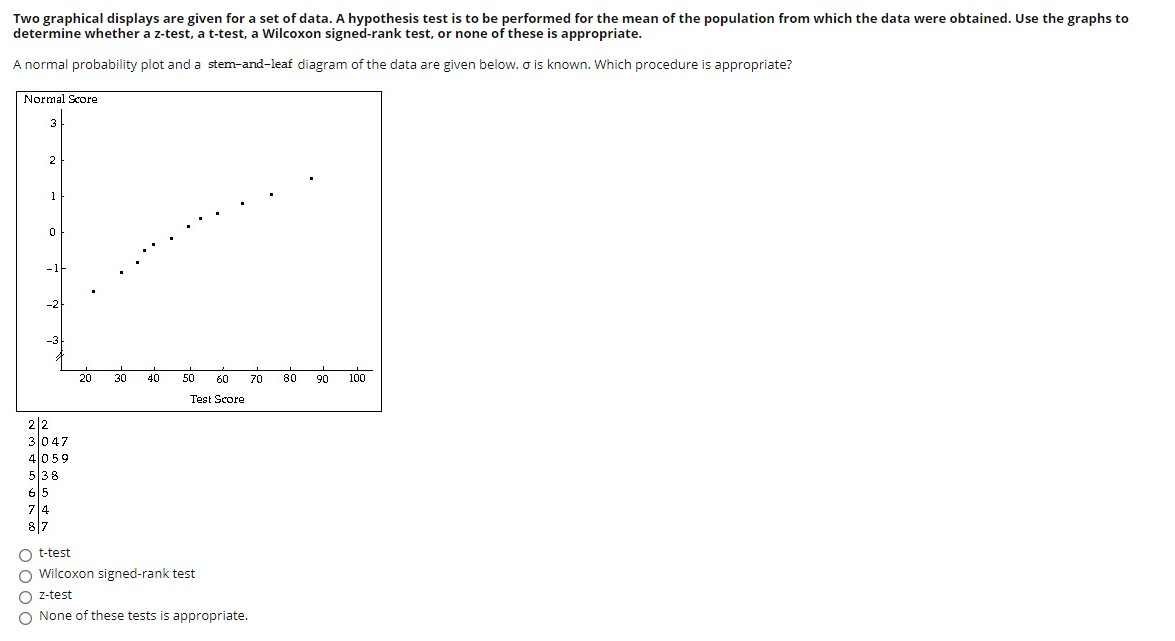
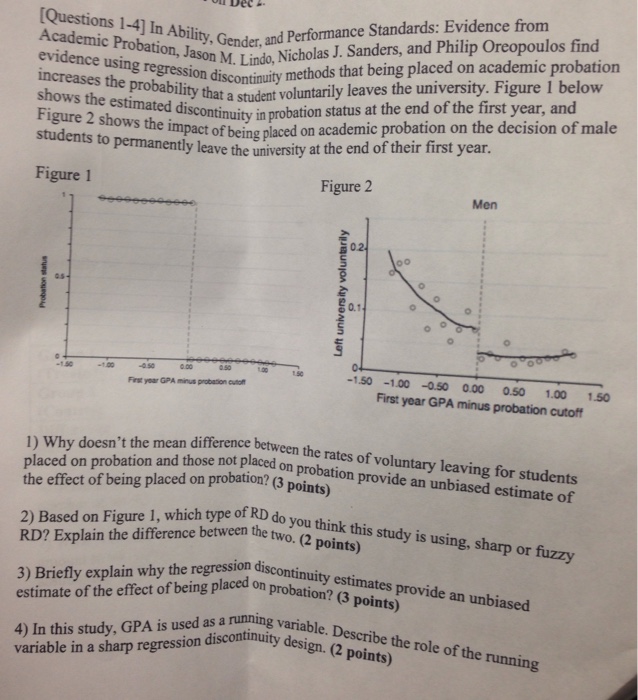
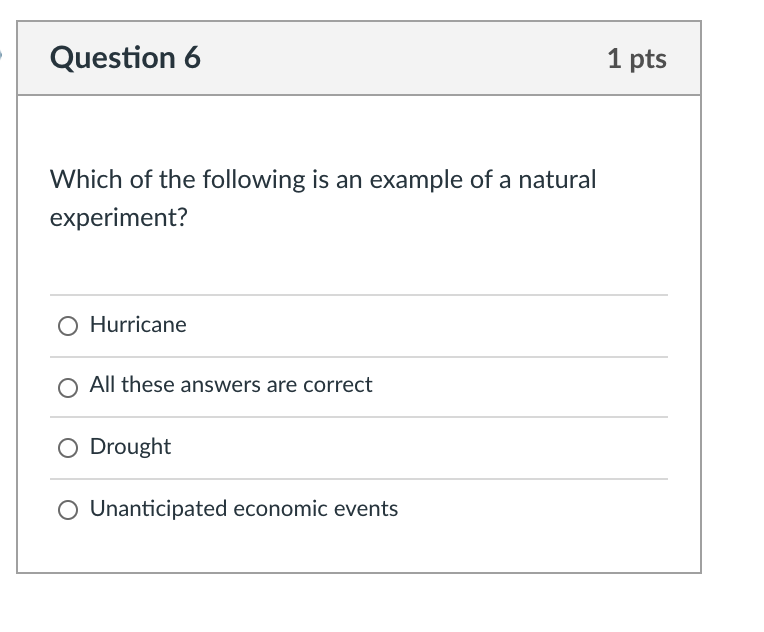
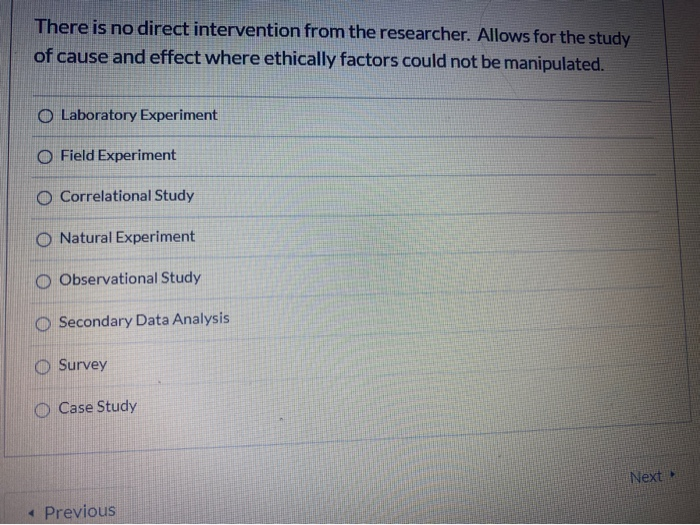
Two graphical displays are given for a set of data. A hypothesis test is to be performed for the mean of the population from which the data were obtained. Use the graphs to determine whether a z-test, a t-test, a Wilcoxon signed-rank test, or none of these is appropriate. A normal probability plot and a stem-and-leaf diagram of the data are given below. o is known. Which procedure is appropriate? Normal Score 3 . . - 1/ -2 -3 20 30 40 50 60 70 80 90 100 Test Score 2 2 3 047 4 059 5 38 6 5 74 O t-test O Wilcoxon signed-rank test O z-test O None of these tests is appropriate.[Questions 1-4] In Ability, Gender, and Performance Standards: Evidence from Academic Probation, Jason M. Lindo, Nicholas J. Sanders, and Philip Oreopoulos find evidence using regression discontinuity methods that being placed on academic probation increases the probability that a student voluntarily leaves the university. Figure I below shows the estimated discontinuity in probation status at the end of the first year, and Figure 2 shows the impact of being placed on academic probation on the decision of male students to permanently leave the university at the end of their first year. Figure 1 Figure 2 Men 0.2 Probation status Left university voluntarily 50.1 -1.50 Fire your GPA minus probation cutoff -1.50 -1.00 -0.50 0.00 0.50 1.00 1.50 First year GPA minus probation cutoff 1) Why doesn't the mean difference between the rates of voluntary leaving for students placed on probation and those not placed on probation provide an unbiased estimate of the effect of being placed on probation? (3 points) 2) Based on Figure 1, which type of RD do you think this study is using, sharp or fuzzy RD? Explain the difference between the two. (2 points) 3) Briefly explain why the regression discontinuity estimates provide an unbiased estimate of the effect of being placed on probation? (3 points) 4) In this study, GPA is used as a running variable. Describe the role of the running variable in a sharp regression discontinuity design. (2 points)Which of the following is an example of a natural experiment? 0 Hurricane 0 All these anawers are correct 0 Drought 0 Unanticipated economic events There is no direct intervention from the researcher. Allows for the study of cause and effect where ethically factors could not be manipulated. O Laboratory Experiment O Field Experiment O Correlational Study Natural Experiment Observational Study Secondary Data Analysis Survey Case Study Next Previous


