

Answered step by step
Verified Expert Solution
Question
1 Approved Answer
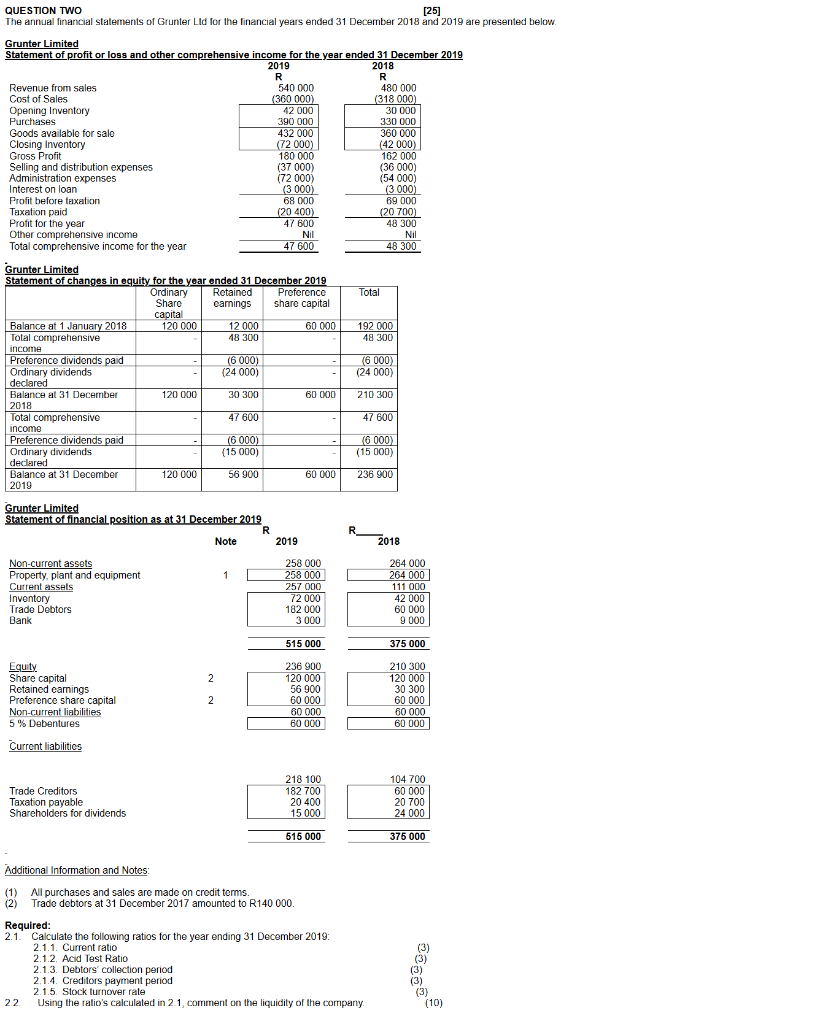
QUESTION TWO [25] The annual financial statements of Grunter Lid for the financial years ended 31 December 2018 and 2019 are presented below. Grunter Limited
Step by Step Solution
There are 3 Steps involved in it
Step: 1

Get Instant Access to Expert-Tailored Solutions
See step-by-step solutions with expert insights and AI powered tools for academic success
Step: 2

Step: 3
Ace Your Homework with AI
Get the answers you need in no time with our AI-driven, step-by-step assistance
Get Started
Auditing The Procurement Function The Iia Research Foundation Handbook Series
Authors: David O Regan, CIA, FCA
1st Edition
0894136224, 978-0894136221