QUESTION: Using the data provided in case, what is the NPV of the project?
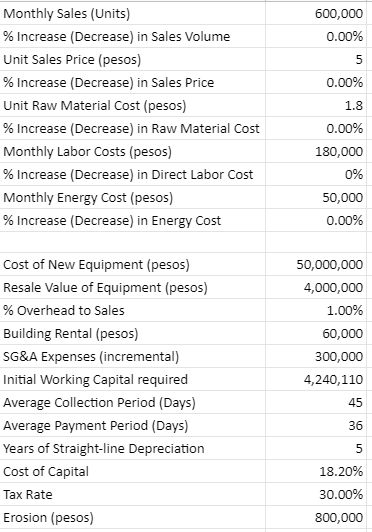
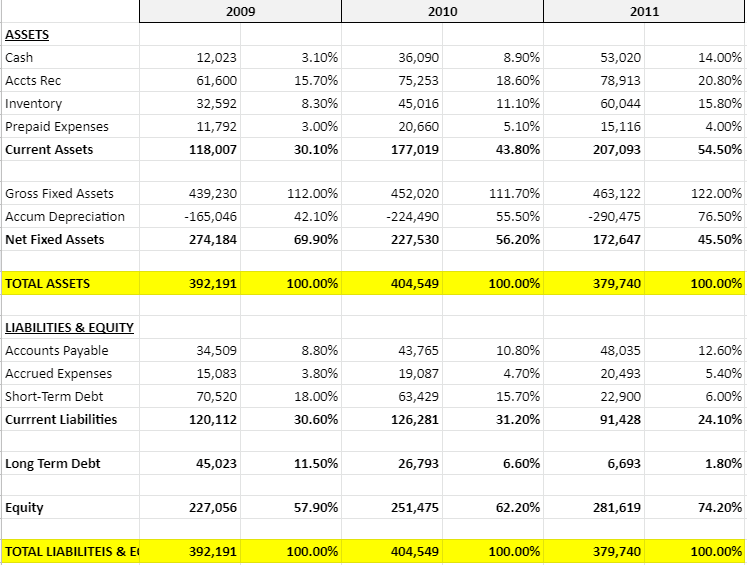
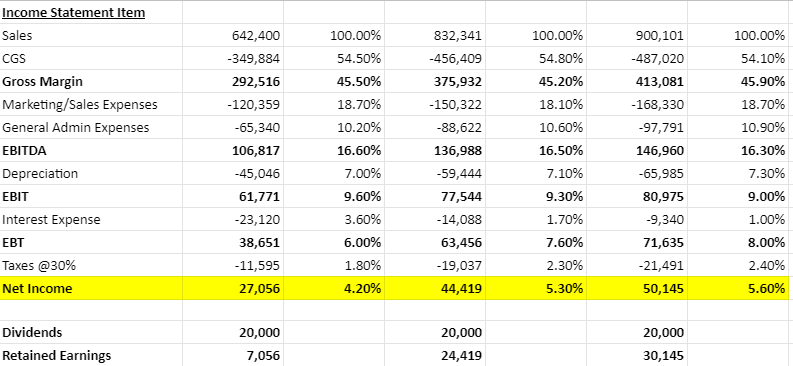
600,000 0.00% 5 0.00% 1.8 Monthly Sales (Units) % Increase (Decrease) in Sales Volume Unit Sales Price (pesos) % Increase (Decrease) in Sales Price Unit Raw Material Cost (pesos) % Increase (Decrease) in Raw Material Cost Monthly Labor Costs (pesos) % Increase (Decrease) in Direct Labor Cost Monthly Energy Cost (pesos) % Increase (Decrease) in Energy Cost 0.00% 180,000 0% 50,000 0.00% 50,000,000 4,000,000 1.00% 60,000 300,000 4,240,110 Cost of New Equipment (pesos) Resale Value of Equipment (pesos) % Overhead to Sales Building Rental (pesos) SG&A Expenses (incremental) Initial Working Capital required Average Collection Period (Days) Average Payment Period (Days) Years of Straight-line Depreciation Cost of Capital Tax Rate Erosion (pesos) 45 36 5 18.20% 30.00% 800,000 2009 2010 2011 ASSETS Cash Accts Rec Inventory Prepaid Expenses Current Assets 12,023 61,600 32,592 11,792 118,007 3.10% 15.70% 8.30% 3.00% 30.10% 36,090 75,253 45,016 20,660 177,019 8.90% 18.60% 11.10% 5.10% 43.80% 53,020 78,913 60,044 15,116 207,093 14.00% 20.80% 15.80% 4.00% 54.50% Gross Fixed Assets Accum Depreciation Net Fixed Assets 439,230 -165,046 274,184 112.00% 42.10% 69.90% 452,020 -224,490 111.70% 55.50% 56.20% 463,122 -290,475 172,647 122.00% 76.50% 45.50% 227,530 TOTAL ASSETS 392,191 100.00% 404,549 100.00% 379,740 100.00% LIABILITIES & EQUITY Accounts Payable Accrued Expenses Short-Term Debt Current Liabilities 34,509 15,083 70,520 120,112 8.80% 3.80% 18.00% 30.60% 43,765 19,087 63,429 126,281 10.80% 4.70% 15.70% 48,035 20,493 22,900 91,428 12.60% 5.40% 6.00% 31.20% 24.10% Long Term Debt 45,023 11.50% 26,793 6.60% 6,693 1.80% Equity 227,056 57.90% 251,475 62.20% 281,619 74.20% TOTAL LIABILITEIS & E 392,191 100.00% 404,549 100.00% 379,740 100.00% Income Statement Item Sales CGS Gross Margin Marketing/Sales Expenses General Admin Expenses EBITDA Depreciation EBIT Interest Expense EBT Taxes @30% Net Income 642,400 -349,884 292,516 -120,359 -65,340 106,817 -45,046 61,771 -23,120 38,651 -11,595 27,056 100.00% 54.50% 45.50% 18.70% 10.20% 16.60% 7.00% 9.60% 3.60% 6.00% 1.80% 4.20% 832,341 -456,409 375,932 -150,322 -88,622 136,988 -59,444 77,544 - 14,088 63,456 -19,037 44,419 100.00% 54.80% 45.20% 18.10% 10.60% 16.50% 7.10% 9.30% 1.70% 7.60% 2.30% 5.30% 900,101 -487,020 413,081 -168,330 -97,791 146,960 -65,985 80,975 -9,340 71,635 -21,491 50,145 100.00% 54.10% 45.90% 18.70% 10.90% 16.30% 7.30% 9.00% 1.00% 8.00% 2.40% 5.60% 20,000 Dividends Retained Earnings 20,000 24,419 20,000 30,145 7,056 600,000 0.00% 5 0.00% 1.8 Monthly Sales (Units) % Increase (Decrease) in Sales Volume Unit Sales Price (pesos) % Increase (Decrease) in Sales Price Unit Raw Material Cost (pesos) % Increase (Decrease) in Raw Material Cost Monthly Labor Costs (pesos) % Increase (Decrease) in Direct Labor Cost Monthly Energy Cost (pesos) % Increase (Decrease) in Energy Cost 0.00% 180,000 0% 50,000 0.00% 50,000,000 4,000,000 1.00% 60,000 300,000 4,240,110 Cost of New Equipment (pesos) Resale Value of Equipment (pesos) % Overhead to Sales Building Rental (pesos) SG&A Expenses (incremental) Initial Working Capital required Average Collection Period (Days) Average Payment Period (Days) Years of Straight-line Depreciation Cost of Capital Tax Rate Erosion (pesos) 45 36 5 18.20% 30.00% 800,000 2009 2010 2011 ASSETS Cash Accts Rec Inventory Prepaid Expenses Current Assets 12,023 61,600 32,592 11,792 118,007 3.10% 15.70% 8.30% 3.00% 30.10% 36,090 75,253 45,016 20,660 177,019 8.90% 18.60% 11.10% 5.10% 43.80% 53,020 78,913 60,044 15,116 207,093 14.00% 20.80% 15.80% 4.00% 54.50% Gross Fixed Assets Accum Depreciation Net Fixed Assets 439,230 -165,046 274,184 112.00% 42.10% 69.90% 452,020 -224,490 111.70% 55.50% 56.20% 463,122 -290,475 172,647 122.00% 76.50% 45.50% 227,530 TOTAL ASSETS 392,191 100.00% 404,549 100.00% 379,740 100.00% LIABILITIES & EQUITY Accounts Payable Accrued Expenses Short-Term Debt Current Liabilities 34,509 15,083 70,520 120,112 8.80% 3.80% 18.00% 30.60% 43,765 19,087 63,429 126,281 10.80% 4.70% 15.70% 48,035 20,493 22,900 91,428 12.60% 5.40% 6.00% 31.20% 24.10% Long Term Debt 45,023 11.50% 26,793 6.60% 6,693 1.80% Equity 227,056 57.90% 251,475 62.20% 281,619 74.20% TOTAL LIABILITEIS & E 392,191 100.00% 404,549 100.00% 379,740 100.00% Income Statement Item Sales CGS Gross Margin Marketing/Sales Expenses General Admin Expenses EBITDA Depreciation EBIT Interest Expense EBT Taxes @30% Net Income 642,400 -349,884 292,516 -120,359 -65,340 106,817 -45,046 61,771 -23,120 38,651 -11,595 27,056 100.00% 54.50% 45.50% 18.70% 10.20% 16.60% 7.00% 9.60% 3.60% 6.00% 1.80% 4.20% 832,341 -456,409 375,932 -150,322 -88,622 136,988 -59,444 77,544 - 14,088 63,456 -19,037 44,419 100.00% 54.80% 45.20% 18.10% 10.60% 16.50% 7.10% 9.30% 1.70% 7.60% 2.30% 5.30% 900,101 -487,020 413,081 -168,330 -97,791 146,960 -65,985 80,975 -9,340 71,635 -21,491 50,145 100.00% 54.10% 45.90% 18.70% 10.90% 16.30% 7.30% 9.00% 1.00% 8.00% 2.40% 5.60% 20,000 Dividends Retained Earnings 20,000 24,419 20,000 30,145 7,056