

Considerthemammogramdiagnosticexamplein Section 2.1.4. (a) Showthatthejointprobabilitydistributionofdiagnosisanddiseasestatusisasshownin Table2.6. Giventhatadiagnostictestresultispositive,explainhowthisjointdistribution showsthatthe12%ofincorrectdiagnosesforthe99%ofwomennothavingbreastcancer swampthe86%ofcorrectdiagnosesforthe1%ofwomenactuallyhavingbreastcancer. (b) ThefirsttestfordetectingHIV-positivestatushadasensitivityof0.999andspecificity of 0.9999.Explainwhatthesemean.Ifatthattime1in10,000menweretrulyHIV- positive,findthepositivepredictivevalue.Basedonthisexample,explainthepotential disadvantageofroutinediagnosticscreeningofapopulationforararedisease. TABLE 2.6
Question:
Considerthemammogramdiagnosticexamplein Section 2.1.4.
(a) Showthatthejointprobabilitydistributionofdiagnosisanddiseasestatusisasshownin Table2.6. Giventhatadiagnostictestresultispositive,explainhowthisjointdistribution showsthatthe12%ofincorrectdiagnosesforthe99%ofwomennothavingbreastcancer swampthe86%ofcorrectdiagnosesforthe1%ofwomenactuallyhavingbreastcancer.
(b) ThefirsttestfordetectingHIV-positivestatushadasensitivityof0.999andspecificity of 0.9999.Explainwhatthesemean.Ifatthattime1in10,000menweretrulyHIV-
positive,findthepositivepredictivevalue.Basedonthisexample,explainthepotential disadvantageofroutinediagnosticscreeningofapopulationforararedisease.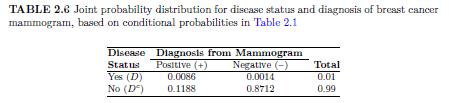
Fantastic news! We've Found the answer you've been seeking!
Step by Step Answer:

Answered By
Mercy Kangai
I provide creative and detailed administrative, web search, academic writing, data entry, Personal assistant, Content writing, Translation, Academic writing, editing and proofreading services. I excel at working under tight deadlines with strict expectations. I possess the self-discipline and time management skills necessary to have served as an academic writer for the past seven years. I can bring value to your business and help solve your administrative assistant issues. I have extensive experience in marketing and small business management.
27+ Reviews
87+ Question Solved
Related Book For 
Foundations Of Statistics For Data Scientists With R And Python
ISBN: 9780367748456
1st Edition
Authors: Alan Agresti
Question Posted:
