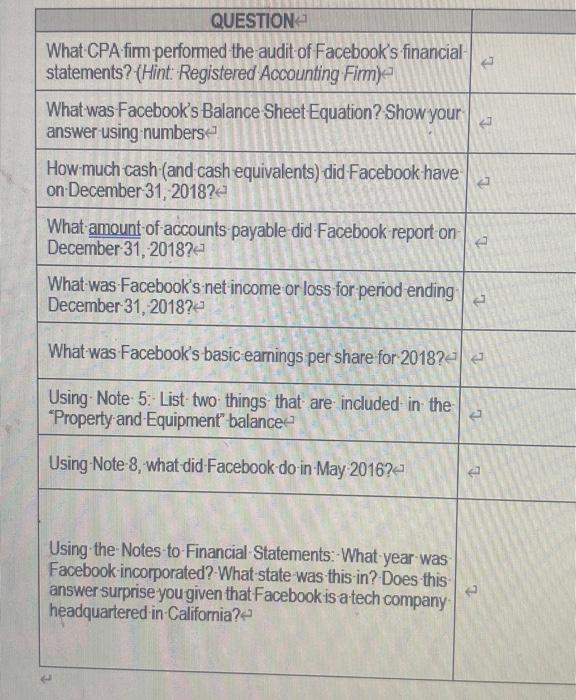
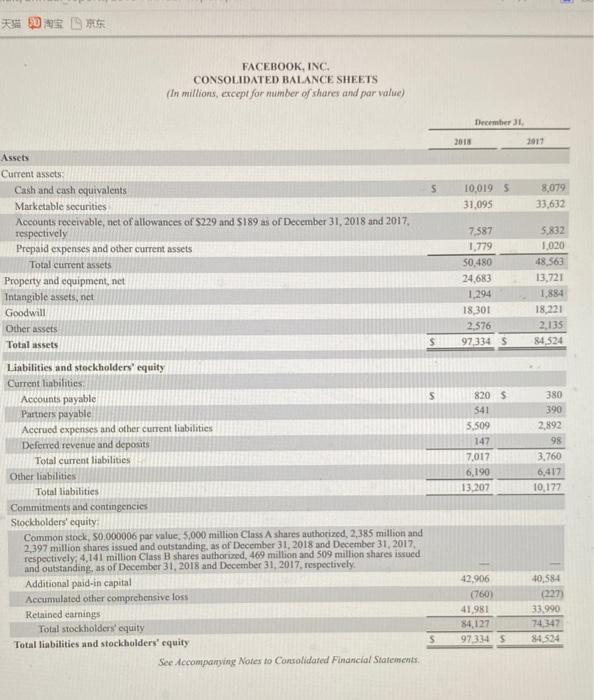
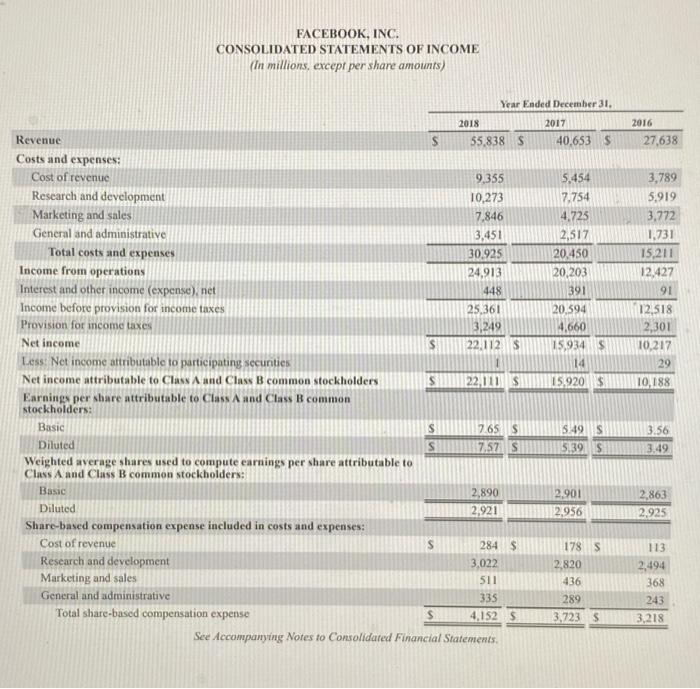
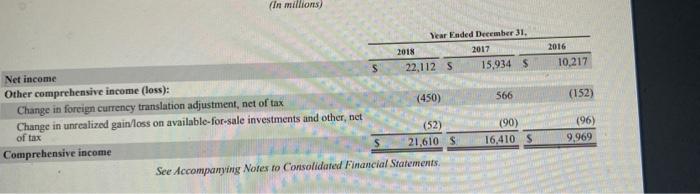
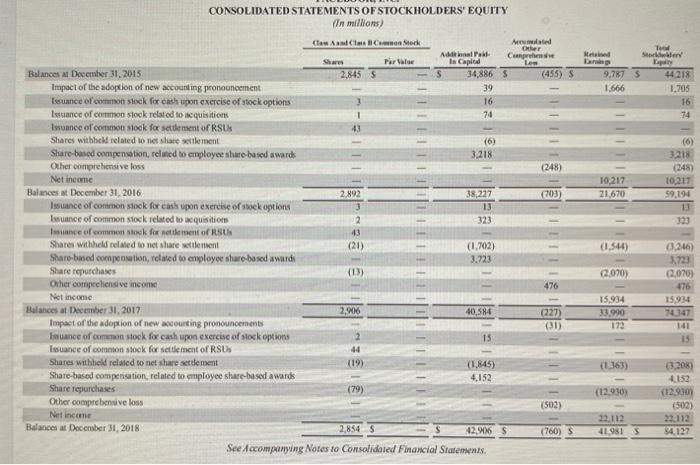
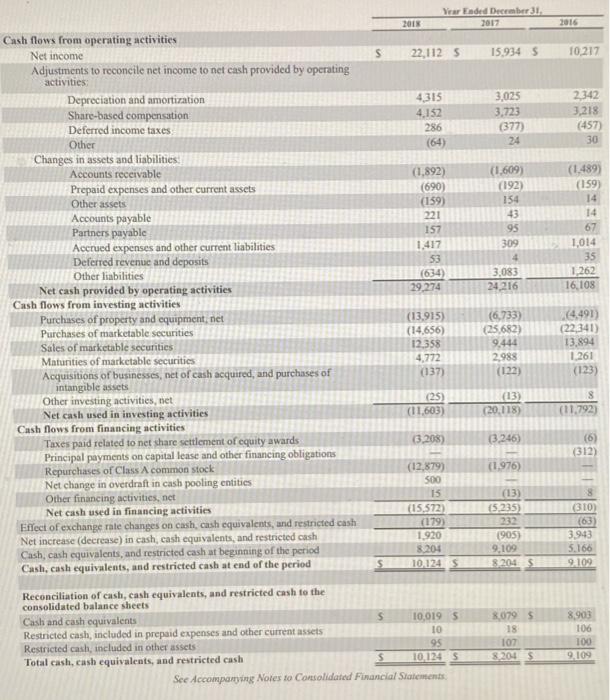
QUESTION What CPA firm performed the audit of Facebook's financial statements? (Hint: Registered Accounting Firm) What was Facebook's Balance Sheet Equation? Show your answer using numbers t. How much cash (and cash equivalents) did Facebook have on December 31, 2018? What amount of accounts payable did Facebook report on December 31, 2018? What was Facebook's net income or loss for period ending December 31, 2018?- e What was Facebook's basic earnings per share for 2018? Using Note 5: List - two things that are included in the *Property and Equipment" balance Using Note 8, what did Facebook do in May 2016? Using the Notes to Financial Statements: What year was Facebook incorporated? What state was this in? Does this answer surprise you given that Facebook is a tech company headquartered in California? FACEBOOK, INC. CONSOLIDATED BALANCE SHEETS (In millions, except for number of shares and par value) December 2018 2017 S 10,0195 31,095 8,079 33,632 Assets Current assets Cash and cash equivalents Marketable securities Accounts receivable, net of allowances of $229 and 5189 as of December 31, 2018 and 2017 respectively Prepaid expenses and other current assets Total current assets Property and equipment, net Intangible assets, net Goodwill Other assets Total assets 7.387 1,779 50,480 24,683 1.294 18,301 2,576 97,334 5 5,832 1,020 48 563 13,721 1,884 18.221 2.135 84,524 S 820 S 541 5,509 147 7,017 6,190 13.207 380 390 2.892 98 3.760 6,417 10.177 Liabilities and stockholders' equity Current liabilities Accounts payable S Partners payable Accrued expenses and other current liabilities Deferred revenue and deposits Total current liabilities Other liabilities Total liabilities Commitments and contingencies Stockholders' equity Common stock, 50.000006 par value, 5,000 million Class A shares authorized, 2,385 million and 2.397 million shares issued and outstanding, as of December 31, 2018 and December 31, 2017, respectively 4,141 million Class B shares authorized 469 million and 509 million shares issued and outstanding, as of December 31, 2018 and December 31, 2017, respectively Additional paid-in capital Accumulated other comprehensive loss Retained earnings Total stockholders' equity Total liabilities and stockholders' equity S See Accompanying Notes to Contolidated Financial Statements, 42,906 (760) 41.981 84,127 973345 40,584 (227) 33.990 74,347 84.534 FACEBOOK, INC. CONSOLIDATED STATEMENTS OF INCOME (In millions, except per share amounts) Year Ended December 31. 2017 40,653 S 2016 27,638 2018 Revenue S 55,838 Costs and expenses: Cost of revenue 9,355 Research and development 10,273 Marketing and sales 7.846 General and administrative 3,451 Total costs and expenses 30.925 Income from operations 24,913 Interest and other income (expense) niet 448 Income before provision for income taxes 25,361 Provision for income taxes 3,249 Net income 22.112 Less: Net income attributable to participating securities Net income attributable to Class A and Class B common stockholders 22,01$ Earnings per share attributable to Class A and Class B common stockholders: Basic S 7.65 S Diluted S 7.52 Weighted average shares used to compute earnings per share attributable to Class A and Class B common stockholders: Basic 2,890 Diluted 2,921 Share-based compensation expense included in costs and expenses: Cost of revenue 284 $ Research and development 3,022 Marketing and sales 511 General and administrative 335 Total share-based compensation expense S 4,152 $ See Accompanying Notes to Consolidated Financial Statements. 5.454 7.754 4.725 2,517 20,450 20,203 391 20,594 4,660 15,934 S 14 15.920$ 3,789 5.919 3,772 1.731 15,211 12,427 91 112,518 2,301 10,217 29 10.188 s 5:49 S 5.39S 3.56 3,49 2.901 2.956 2,863 2.925 113 178 S 2,820 436 289 3,723 5 2,494 368 243 3,218 (in millions) 2016 10,217 (152) Year Ended December 31 2018 2017 Net income 22,112 S 15,934 $ Other comprehensive income (loss): Change in foreign currency translation adjustment, net of tax (450) 566 Change in unrealized gain/loss on available for sale investments and other, net of tax (52) (90) Comprehensive income 21,610 S 16,410 S See Accompanying Notes to Consolidated Financial Statements (96) 9,969 Net To Stown Shares Le 9.787 5 1.666 44 218 1.705 16 74 10.217 21,670 (6) 3.218 (248) 10.217 59,194 11 323 CONSOLIDATED STATEMENTS OF STOCKHOLDERS' EQUITY (in millions) Claw Atlas Con Stork Med Addiala Cuprins Para Is Capital Balances at December 31, 2015 2,8455 34,886 $ (455) Impact of the adoption of new accounting pronouncement 39 Issuance of common stock for cash upon exercise of stock options 16 Istance of common stock related to sequisition 70 Issuance of common stock for settlement of RSUS Shares withheld related to niet share settlement (6) Share-based compensation, reled to employee share based awards 3.218 Other comprehensive loss (248) Net income Balances at December 31, 2016 2.892 38,227 (703) Isouance of common stock for cask upon exercise of stock options 13 Imance of common stock related to acquisition 2 323 Istance of common stock for nettement of RSUS Shares withheld related to ne sarettenent (21) (1.702) Sharo-based compensation, related to employee share based awards 3.723 Share repurchases (13) Other comprehensive income 476 Net income Balances at December 31, 2017 2,216 40,584 (227) Impact of the adoption of new accounting pronouncements (1) nuance of common stock for cash upon exercise of stock options 2 15 Issuance of common stock for settlement of RSS 44 Shares withheld related to not share settlement (19) (1.845) Share-based compensation related to employee share-based awards 4,152 Share repurchases (79) Other comprehensive loss (502) Net income Balances at December 31, 2018 2,854 S 42.906 $ (760) See Accompanying Notes to Consolidated Financial Statements. 111111110111111 (1.544) 2,070) 0.246) 3.723 2,070) 476 15,934 74347 141 15 15,934 33.990 172 1163) (120301 63.205) 4.152 (12.9309 (502) 23.112 84.122 22,112 41.981 2016 10.217 2342 3,218 (457) 30 (1.489) (159) 14 14 67 1,014 35 1.262 16.108 Vear Ended December 31 2018 2017 Cash flows from operating activities Net income S 22,1125 15.934 5 Adjustments to reconcile net income to net cash provided by operating activities Depreciation and amortization 4315 3,025 Share-based compensation 4,152 3,723 Deferred income taxes 286 (377) Other 24 Changes in assets and liabilities: Accounts receivable (1,892) (1.609) Prepaid expenses and other current assets (690) (192) Other assets (159) 154 Accounts payable 221 43 Partners payable 157 95 Accrued expenses and other current liabilities 1.417 309 Deferred revenue and deposits 53 Other liabilities (634) 3,083 Net cash provided by operating activities 29, 274 24,216 Cash flows from investing activities Purchases of property and equipment, net (13.915) (6,733) Purchases of marketable securities (14.656) 25.682) Sales of marketable securities 12.358 9.444 Maturities of marketable securities 4.772 2,988 Acquisitions of businesses, net of cash acquired and purchases of (137) (122) intangible assets Other investing activities, net (25) (13) Net cash used in investing activities (11,603) (20.118) Cash flows from financing activities Taxes paid related to net share settlement of cquity awards (3.208) (3.246) Principal payments on capital lease and other financing obligations Repurchases of Class A common stock (12,879) (1.976) Net change in overdraft in cash pooling entities 500 Other financing activities, net 15 (13) Net cash used in financing activities (15,572) (5.235) Effect of exchange rate changes on cash, cash equivalents, and restricted cash (179) Net increase (decrease) in cash, cash equivalents, and restricted cash 1.920 1905) Cash, cash equivalents, and restricted cash at beginning of the period 80204 9,109 Cash, cash equivalents, and restricted cash at end of the period 10.124 58204S Reconciliation of cash, cash equivalents, and restricted cash to the consolidated balance sheets Cash and cash equivalents 10.019 5 80795 Restricted cash, included in prepaid expenses and other current assets 10 18 Restricted cash, included in other assets 95 107 Total cash, cash equivalents, and restricted cash $ 10.1245 80204 S See Accompanying Notes to Consolidated Financial Statements (4.491) (22,341) 13.894 1.261 (123) (11.792 (6 (312) (310) (63) 3.943 5.166 9.109 8.900 106 100 9,109