

Question: Question: X is a random variable with an exponential distribution with rate ? = 0.7 Thus the pdf of X is f(x) = ? e??x
Question:
X is a random variable with an exponential distribution with rate ? = 0.7 Thus the pdf of X is f(x) = ? e??x
for 0 ? x where ? = 0.7.
a) Using the f(x) above and the R integrate function calculate the expected value of X.
b) Using the f(x) above and the R integrate function calculate the expected value of X0.2
.
c) Using the dexp function and the R integrate command calculate the expected value of X.
d) Using the pexp function find the probability that .33 ? X ? 1
e) Calculate the probability that X > 0.15 by using the pexp function
f) Calculate the probability that X is at least 1.5 more than its expected value. Use the pexp function
g) Copy your R script for the above into the text box here.
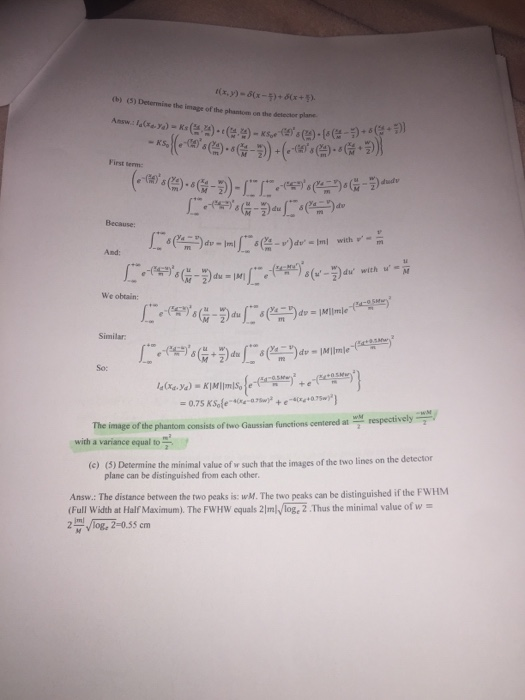
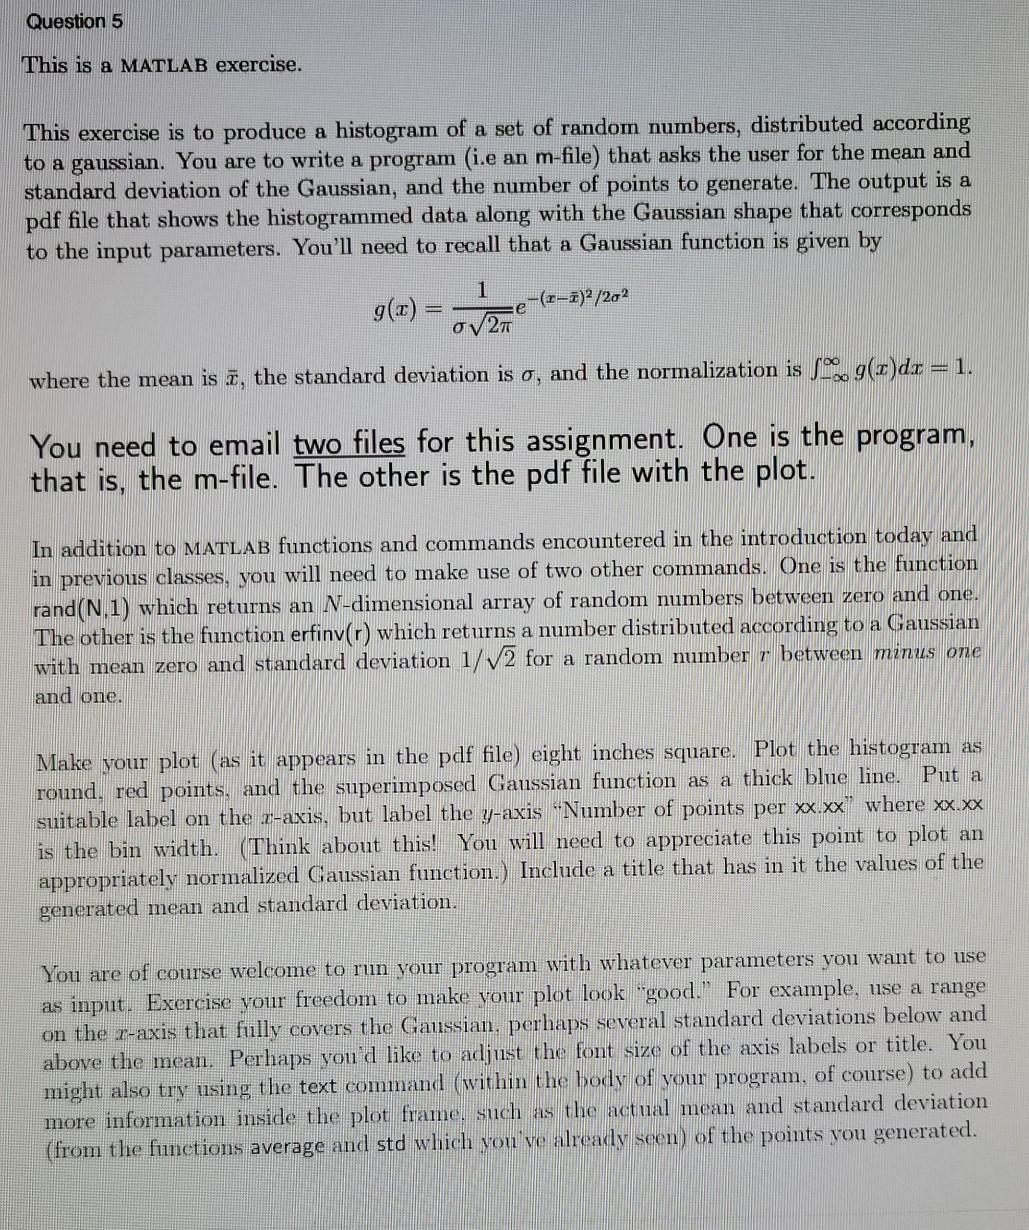
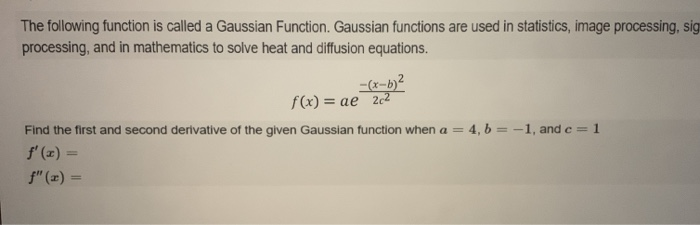
(b) (3) Determine the image of the phantom on the detector plane. First Berme Because: And: We obtain: Similar The image of the phantom consists of two Gaussian functions centered al- wild respectively WN with a variance equal to " (e) (3) Determine the minimal value of w such that the images of the two lines on the detector plane can be distinguished from each other. Answer The distance between the two peaks is: wif. The two peaks can be distinguished if the FWHM (Full Width at Half Maximum). The FWHW equals 2/mlvlog, 2 . Thus the minimal value of w = My Vlog, 2=0.35 cmQuestion 5 This is a MATLAB exercise. This exercise is to produce a histogram of a set of random numbers, distributed according to a gaussian. You are to write a program (i.e an m-file) that asks the user for the mean and standard deviation of the Gaussian, and the number of points to generate. The output is a pdf file that shows the histogrammed data along with the Gaussian shape that corresponds to the input parameters. You'll need to recall that a Gaussian function is given by g(I) = e (2-2)2/202 ov27 where the mean is z, the standard deviation is o, and the normalization is Jog(r)dr = 1. You need to email two files for this assignment. One is the program, that is, the m-file. The other is the pdf file with the plot. In addition to MATLAB functions and commands encountered in the introduction today and in previous classes, you will need to make use of two other commands. One is the function rand (N.1) which returns an N-dimensional array of random numbers between zero and one. The other is the function erfinv(r) which returns a number distributed according to a Gaussian with mean zero and standard deviation 1/v2 for a random number 7 between minus one and one. Make your plot (as it appears in the pdf file) eight inches square. Plot the histogram as round, red points, and the superimposed Gaussian function as a thick blue line. Put a suitable label on the r-axis, but label the y-axis "Number of points per xxxx where xx.xx is the bin width. (Think about this! You will need to appreciate this point to plot an appropriately normalized Gaussian function.) Include a title that has in it the values of the generated mean and standard deviation. You are of course welcome to run your program with whatever parameters you want to use as input. Exercise your freedom to make your plot look "good." For example, use a range on the r-axis that fully covers the Gaussian, perhaps several standard deviations below and above the mean. Perhaps you'd like to adjust the font size of the axis labels or title. You might also try using the text command ( within the body of your program, of course) to add more information inside the plot frame, such as the actual mean and standard deviation ( from the functions average and std which you've already seen) of the points you generated.The following function is called a Gaussian Function. Gaussian functions are used in statistics, image processing, sig processing, and in mathematics to solve heat and diffusion equations. -(x-b)2 f(x) = ae 202 Find the first and second derivative of the given Gaussian function when a = 4, b = -1, and c = 1 f' (I) = f" (I) =
Step by Step Solution
There are 3 Steps involved in it

Get step-by-step solutions from verified subject matter experts