Answered step by step
Verified Expert Solution
Question
1 Approved Answer
Question ) You are asked to write a FORTRAN program making a discount promotion chart for a souvenir store in Niagara - on - the
Question You are asked to write a FORTRAN program making a discount promotion chart for a souvenir
store in NiagaraontheLake, Ontario. Your discount chart should have three columns. The first column
lists the items' original price tag in CAD, and the second & third column provide the discounted prices
after tax respectively in CAD and USD. All original price tags of the store are ended in or Your
program should receive the maximum and minimum price tags, discount percentage should be applied
to original price tag and CAD to USD exchange rate via keyboard entry.
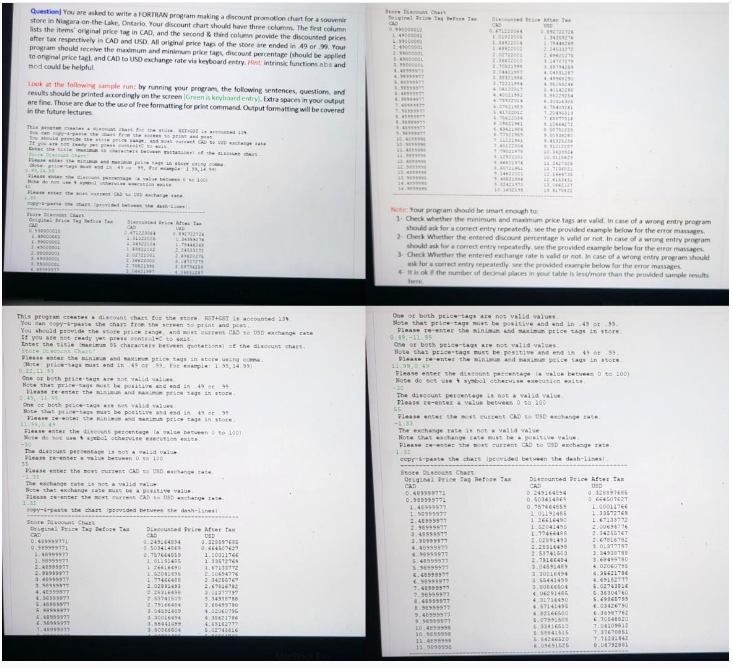
Look at the following sample run: by running your program, the following sentences, questions, and
results should be printed accordingly on the screen Green is keyboard entry Extra spaces in your output
are fine. Those are due to the use of free formatting for print command. Output formatting will be covered
in the future lectures.
This program creates a discount chart for the store. HSTGST is accounted
You can copyspaste the chart from the screen to print and post.
You should provide the store price range, and most current CAD to USD exchange rate
If you are not ready yet press controlC to exit.
Enter the title maximum characters between quotations of the discount chart.
"Store Discount Chart"
Please enter the minimum and maximum price tags in store using conma.
Note: pricetags must end in or For example:
Please enter the discount percentage a value between to
Note do not use of symbol otherwise execution exits.
Please enter the most current CAD to USD exchange rate.
copy&paste the chart provided between the dashlines
Store Discount Chart
Original Price Tag Before Tax Discounted Price After Tax
CAD
CAD USD
Please use matrixs

Step by Step Solution
There are 3 Steps involved in it
Step: 1

Get Instant Access to Expert-Tailored Solutions
See step-by-step solutions with expert insights and AI powered tools for academic success
Step: 2

Step: 3

Ace Your Homework with AI
Get the answers you need in no time with our AI-driven, step-by-step assistance
Get Started


