.Question3 v ( ' ) Suppose that textbook weights are normally distributed. You measure 42 textbooks' weights, and find they have a mean weight of
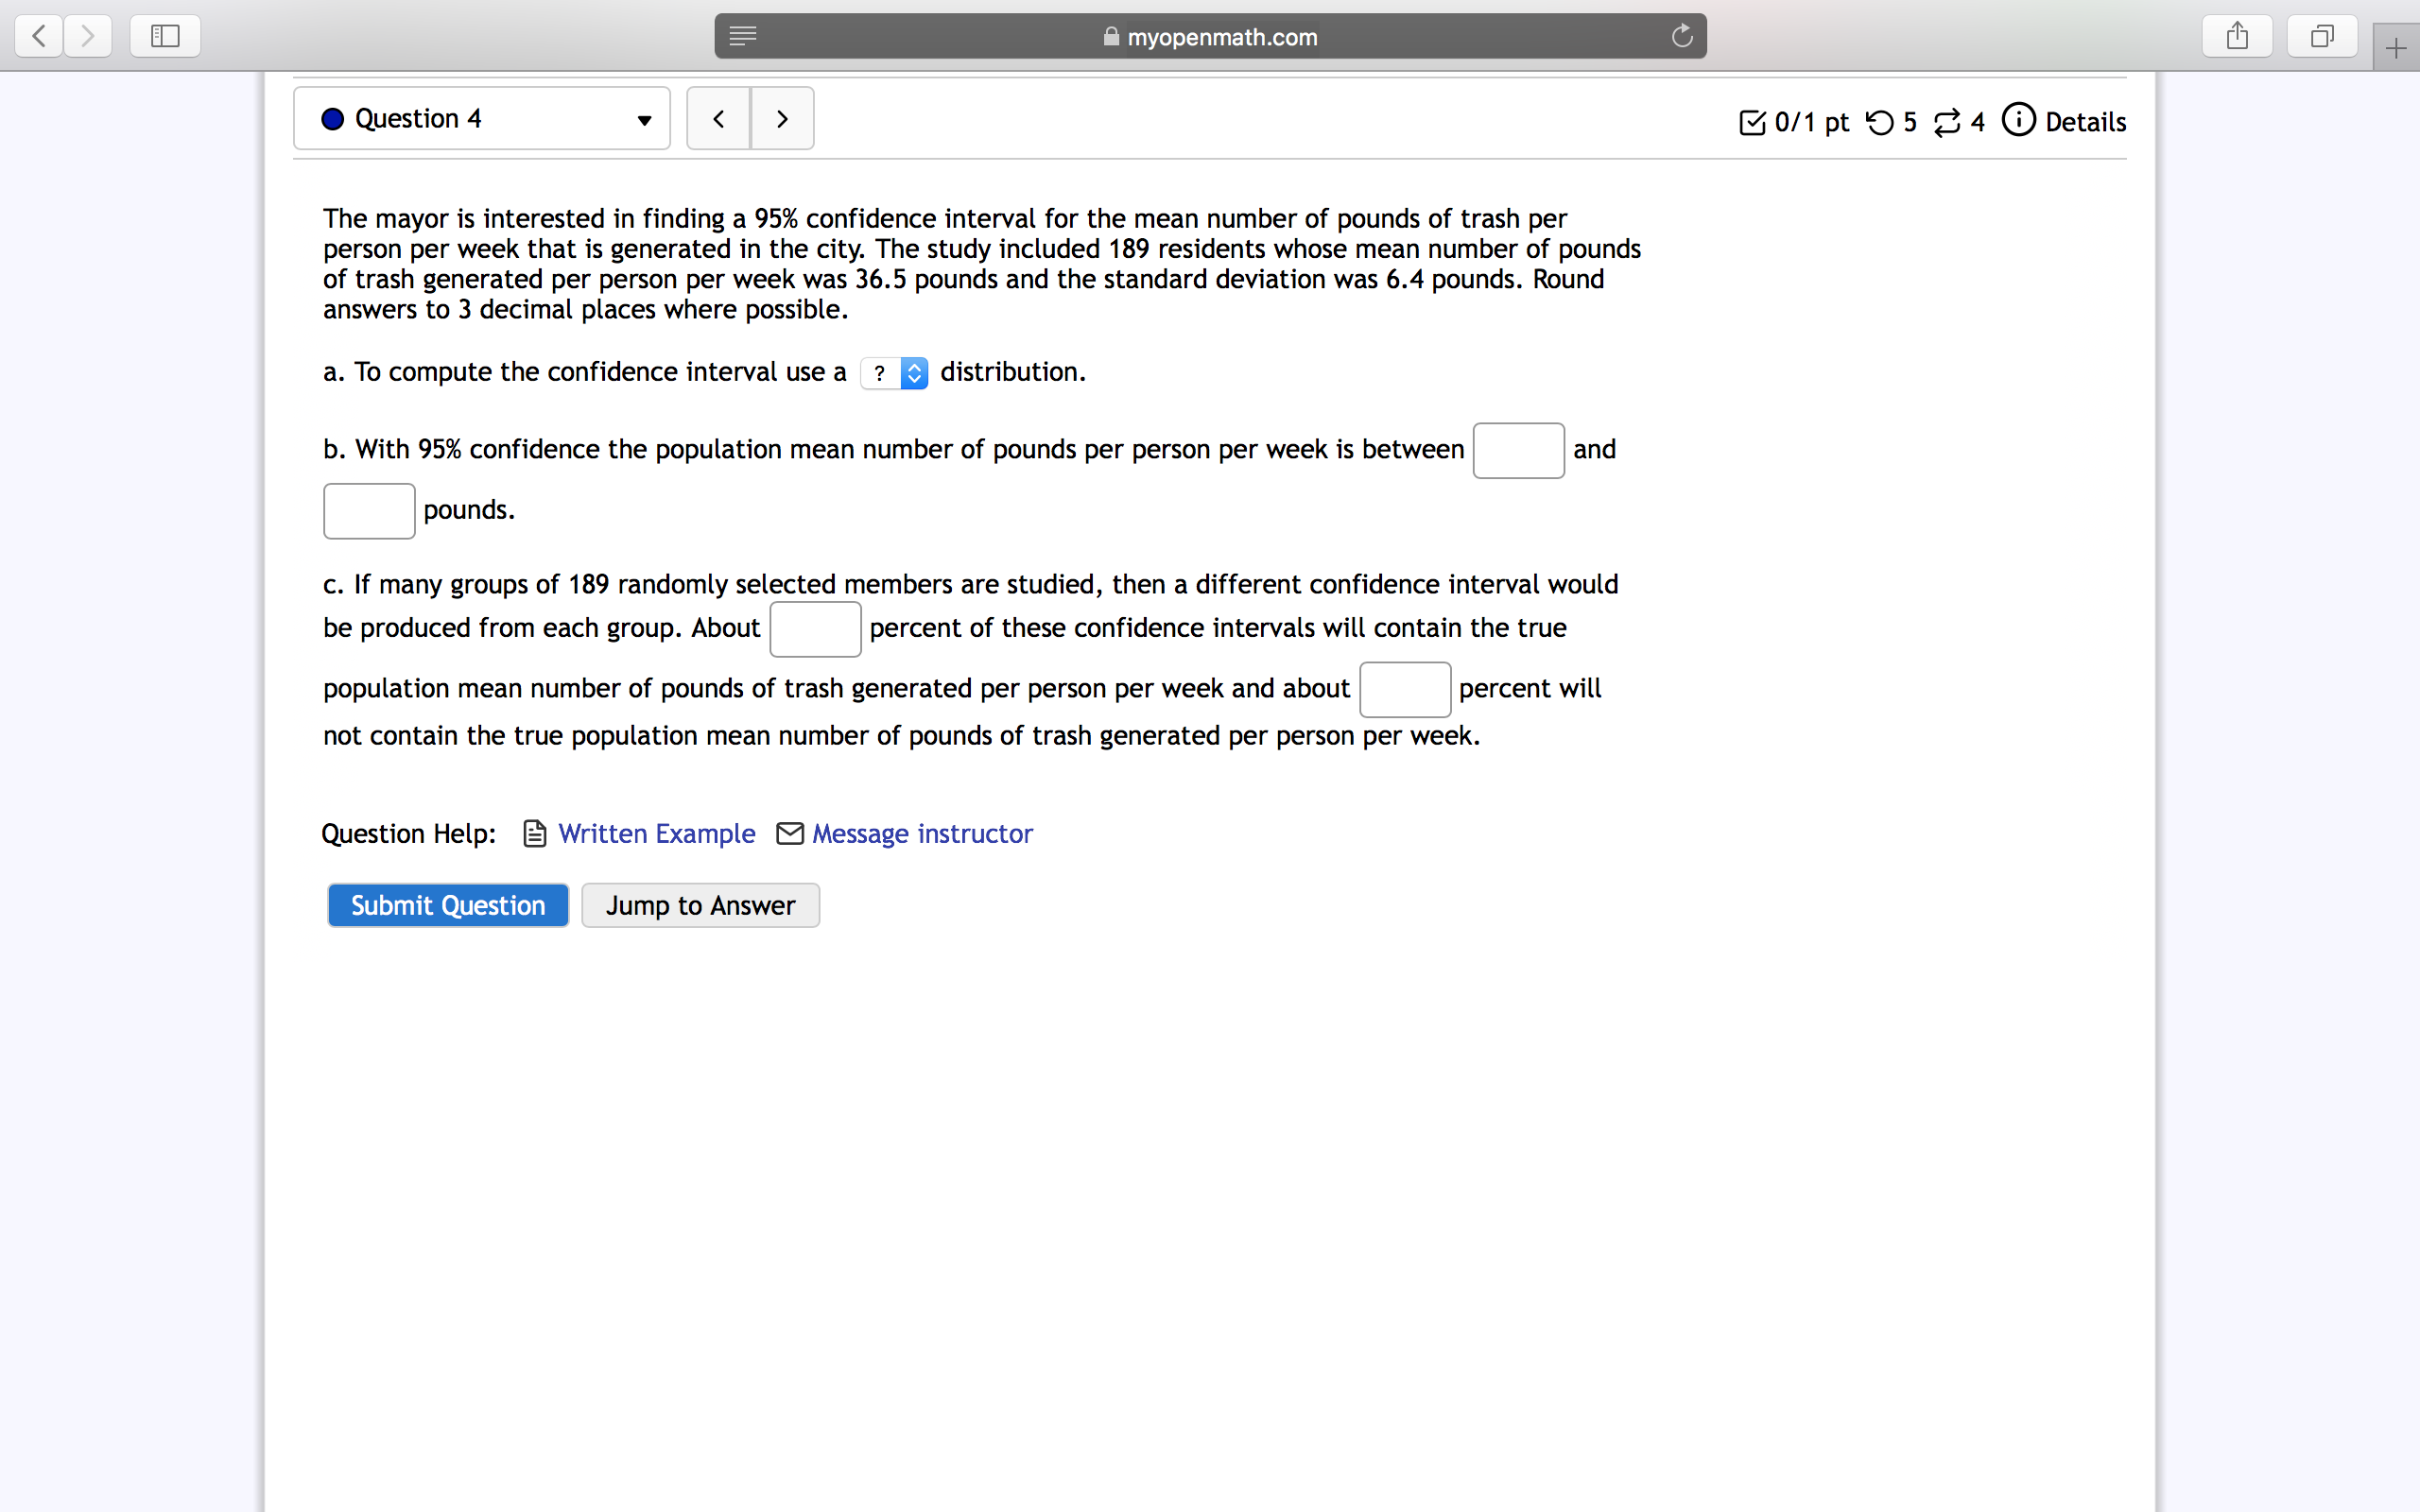
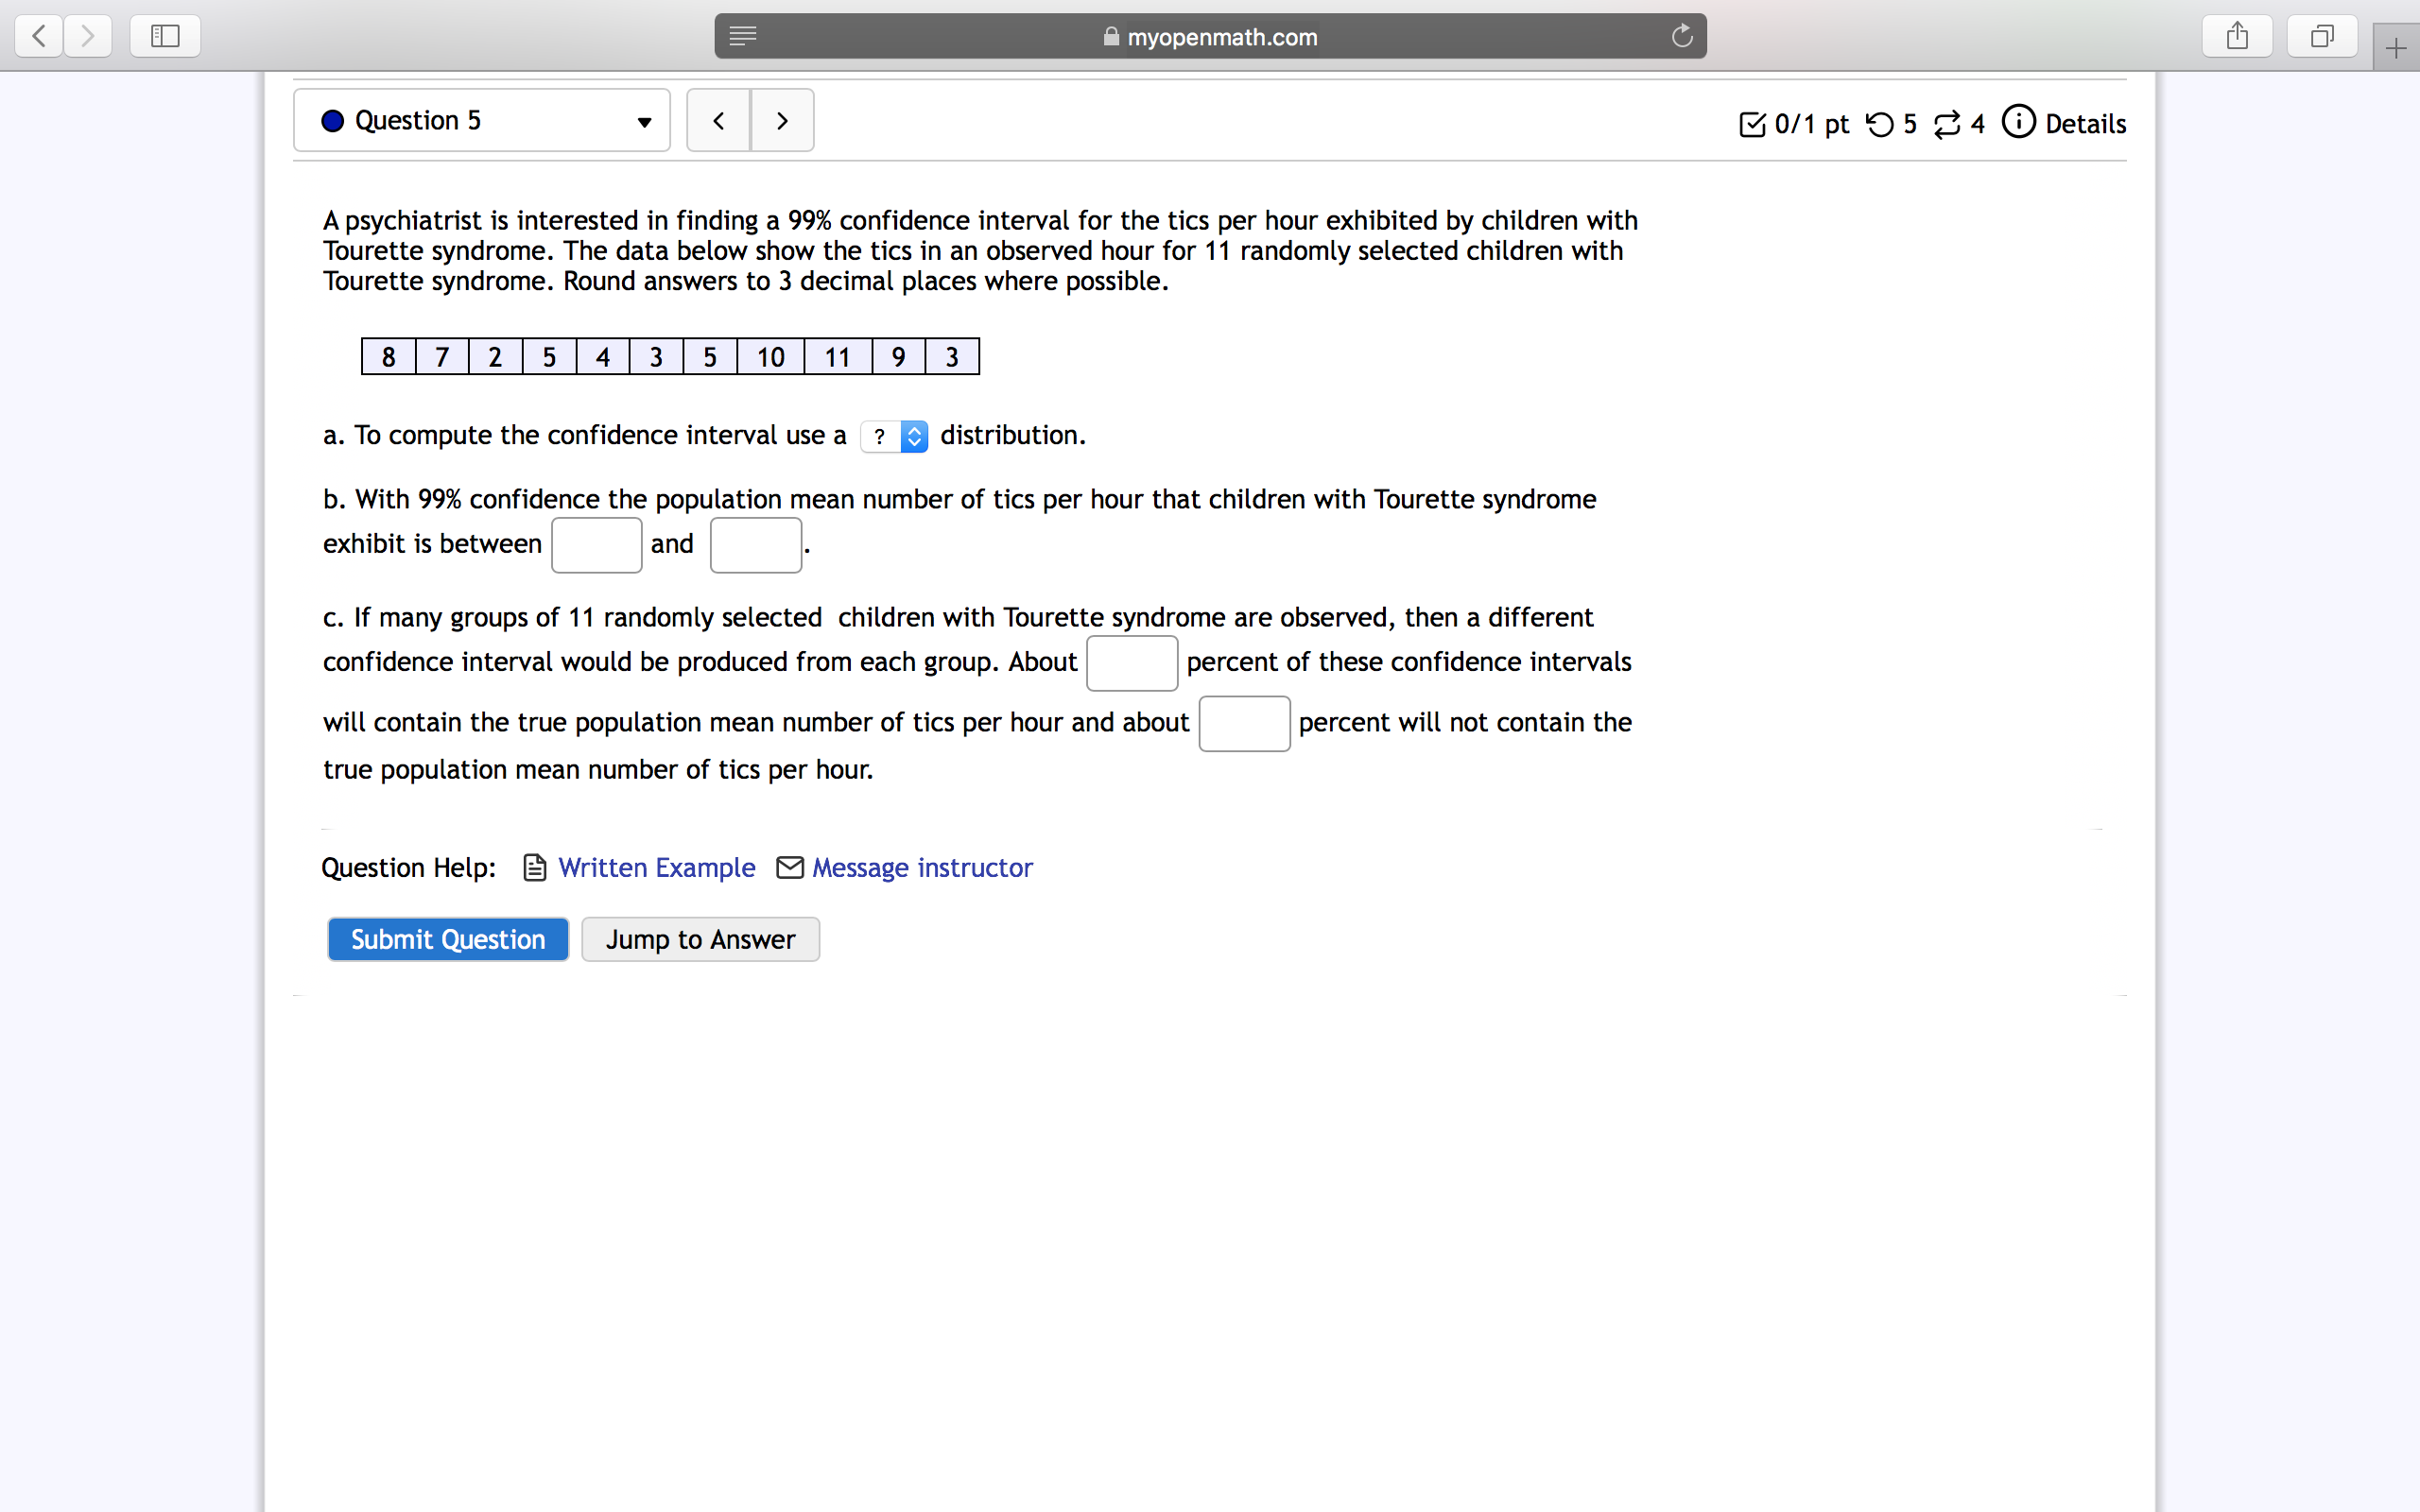
.Question3 v\" ( ' ) Suppose that textbook weights are normally distributed. You measure 42 textbooks' weights, and find they have a mean weight of 42 ounces. Assume the population standard deviation is 9.7 ounces. Based on this, construct a 95% confidence interval for the true population mean textbook weight. Round answers to 2 decimal places. Question Help: [Q Written Example 8 Message instructor Submit Question l Jump to Answer l 30/11 0 5 3 4 (D Details Lui- imyopenmathcom , i iii . '5] I 0 Question 4 v B 0/1 pt .0 5 Z 4 G) Details The mayor is interested in finding a 95% confidence interval for the mean number of pounds of trash per person per week that is generated in the city. The study included 189 residents whose mean number of pounds of trash generated per person per week was 36.5 pounds and the standard deviation was 6.4 pounds. Round answers to 3 decimal places where possible. a. To compute the confidence interval use a 3' distribution. b. With 95% confidence the population mean number of pounds per person per week is between D and C] pounds. c. If many groups of 189 randomly selected members are studied, then a different confidence interval would be produced from each group. About [3 percent of these confidence intervals will contain the true population mean number of pounds of trash generated per person per week and about [3 percent will not contain the true population mean number of pounds of trash generated per person per week. Question Help: [a Written Example Message instructor Submit Question l Jump to Answer l myopenmath.com Question 5 0/1 pt 95 2 4 0 Details A psychiatrist is interested in finding a 99% confidence interval for the tics per hour exhibited by children with Tourette syndrome. The data below show the tics in an observed hour for 11 randomly selected children with Tourette syndrome. Round answers to 3 decimal places where possible. 8 7 2 5 4 3 5 10 11 9 3 a. To compute the confidence interval use a ? @ distribution. b. With 99% confidence the population mean number of tics per hour that children with Tourette syndrome exhibit is between and c. If many groups of 11 randomly selected children with Tourette syndrome are observed, then a different confidence interval would be produced from each group. About percent of these confidence intervals will contain the true population mean number of tics per hour and about percent will not contain the true population mean number of tics per hour. Question Help: Written Example Message instructor Submit Question Jump to Answeri myopenmathcom 2' .Question9 v'
Step by Step Solution
There are 3 Steps involved in it
Step: 1
Get Instant Access to Expert-Tailored Solutions
See step-by-step solutions with expert insights and AI powered tools for academic success
Step: 2
Step: 3
Ace Your Homework with AI
Get the answers you need in no time with our AI-driven, step-by-step assistance