Answered step by step
Verified Expert Solution
Question
1 Approved Answer
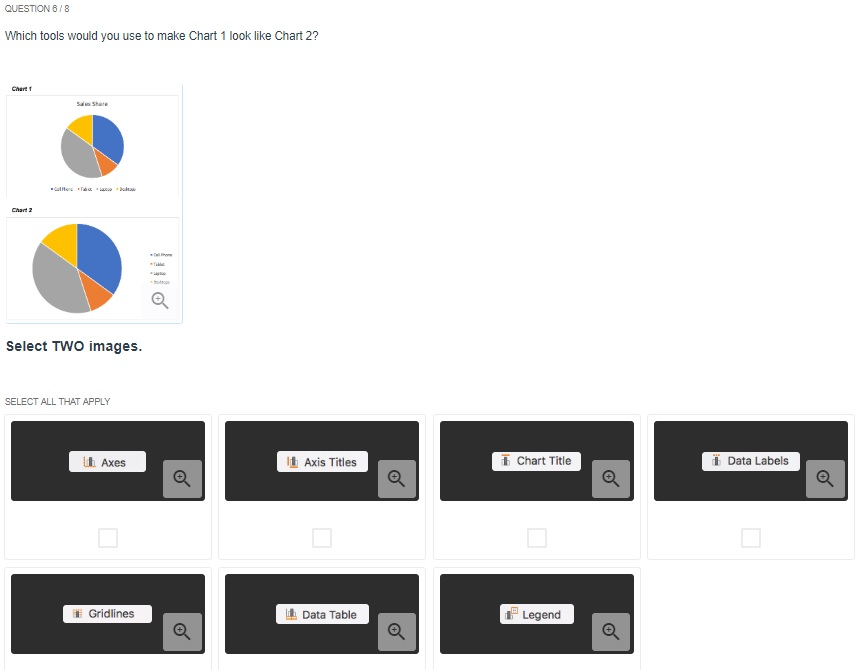
----------------------------- QUESTION618 Which tools would you use to make Chart 1 look like Chart 2? Chard t Shae Select TWo images. SELECT ALL THAT APPLY
-----------------------------
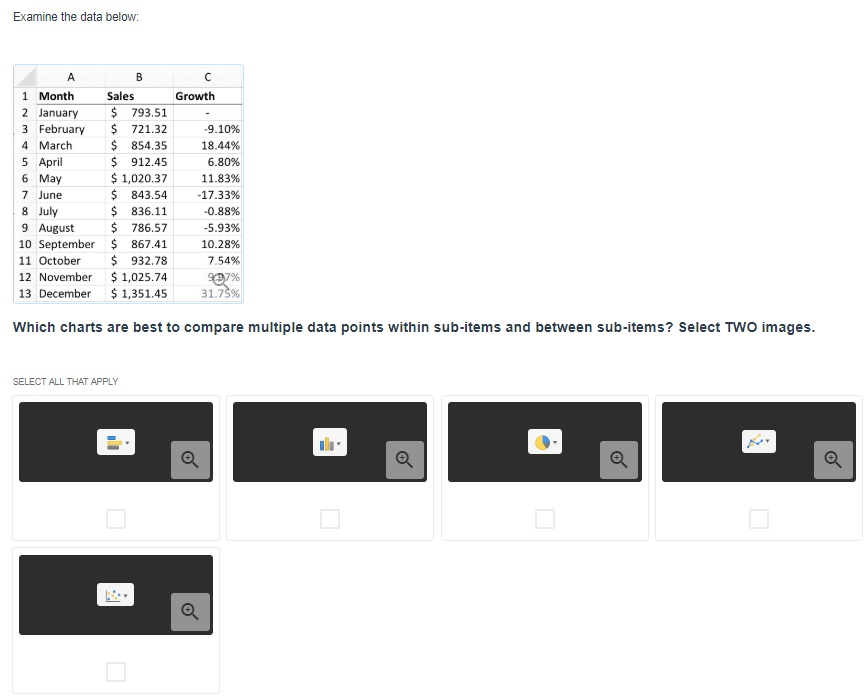
QUESTION618 Which tools would you use to make Chart 1 look like Chart 2? Chard t Shae Select TWo images. SELECT ALL THAT APPLY 1 Chart Title Data Labels Axes 1 Axis Titles Gridlines Data Table Legend Examine the data below 1 Month Sales 2 January 793.51 3 February $721.32-9.10% 4 March 5 April 6 May Growth $854.35 18.44% 6.80% $1,020.37 11.83% $ 843.54-17.33% -0.88% $786.57-5.93% 10.28% 7.54% 912.45 17 June 8 July 9 August 10 September $ 867.41 836.11 11 October932.78 12 November $1,025.74 13 December $1,351.45 31.75% Which charts are best to compare multiple data points within sub-items and between sub-items? Select TWo images SELECT ALL THAT APPLY QUESTION618 Which tools would you use to make Chart 1 look like Chart 2? Chard t Shae Select TWo images. SELECT ALL THAT APPLY 1 Chart Title Data Labels Axes 1 Axis Titles Gridlines Data Table Legend Examine the data below 1 Month Sales 2 January 793.51 3 February $721.32-9.10% 4 March 5 April 6 May Growth $854.35 18.44% 6.80% $1,020.37 11.83% $ 843.54-17.33% -0.88% $786.57-5.93% 10.28% 7.54% 912.45 17 June 8 July 9 August 10 September $ 867.41 836.11 11 October932.78 12 November $1,025.74 13 December $1,351.45 31.75% Which charts are best to compare multiple data points within sub-items and between sub-items? Select TWo images SELECT ALL THAT APPLY
Step by Step Solution
There are 3 Steps involved in it
Step: 1
Get Instant Access to Expert-Tailored Solutions
See step-by-step solutions with expert insights and AI powered tools for academic success
Step: 2
Step: 3
Ace Your Homework with AI
Get the answers you need in no time with our AI-driven, step-by-step assistance
Get Started