Question
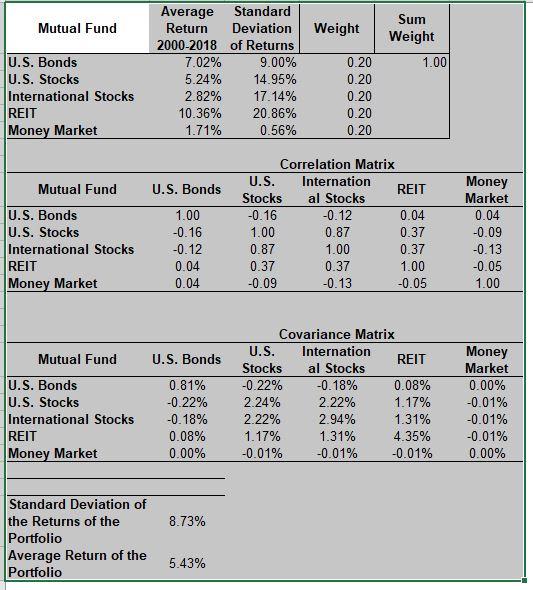
QUESTIONS 1. Look at the Portfolio for the parameters of average annual returns, standard deviations of returns, and correlations among returns of the five mutual

QUESTIONS 1. Look at the Portfolio for the parameters of average annual returns, standard deviations of returns, and correlations among returns of the five mutual funds. They are historical average returns, standard deviations, and correlations during 2000-2018.
a. Do you think that these parameters are also good estimates of future parameters?
b. The standard deviation of returns of U.S. bonds during 2000-2018 was lower than the standard deviation of return of U.S. stocks during the period. Do you think that it is reasonable to expect this will be true in the future as well?
2. As you see in the Portfolio, the return of the portfolio whereby the 5 funds are weighted equally (Weight = 0.20 for each fund) is 5.43% with a standard deviation of returns of 8.73%.
a. Is the realized return of the portfolio equal to the average realized return of the 5 funds, or is it higher or lower?
b. Is the standard deviation of the realized return of the portfolio equal to the average realized standard deviations of the returns of the 5 funds, or is it higher or lower? Why is it so?
3. Create at least 5 changes in the original portfolio parameters of returns, standard deviations of returns, and correlations among returns (e.g. change the correlation between the returns U.S. stocks and International stocks from 0.87 to 0.50). Make the changes in parameters one at a time, so they are relative to the original parameters.
o Comment on the way each change in the original portfolio parameters affects the returns and standard deviation of returns of the portfolio, and the reason for that effects.
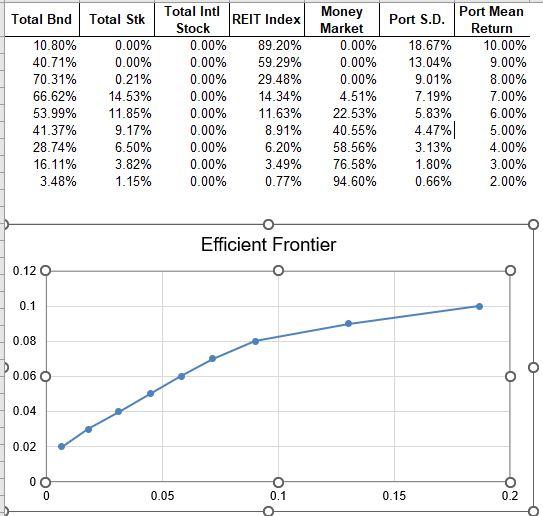
4. Create at least 10 portfolios by varying the weights of the 5 funds in the portfolios, leaving as is the original average returns, standard deviations of returns, and correlations. (Make sure that the weights add up to 1.)
o Display each portfolio as a dot on the graph of the efficient frontier below

Step by Step Solution
There are 3 Steps involved in it
Step: 1

Get Instant Access to Expert-Tailored Solutions
See step-by-step solutions with expert insights and AI powered tools for academic success
Step: 2

Step: 3

Ace Your Homework with AI
Get the answers you need in no time with our AI-driven, step-by-step assistance
Get Started


