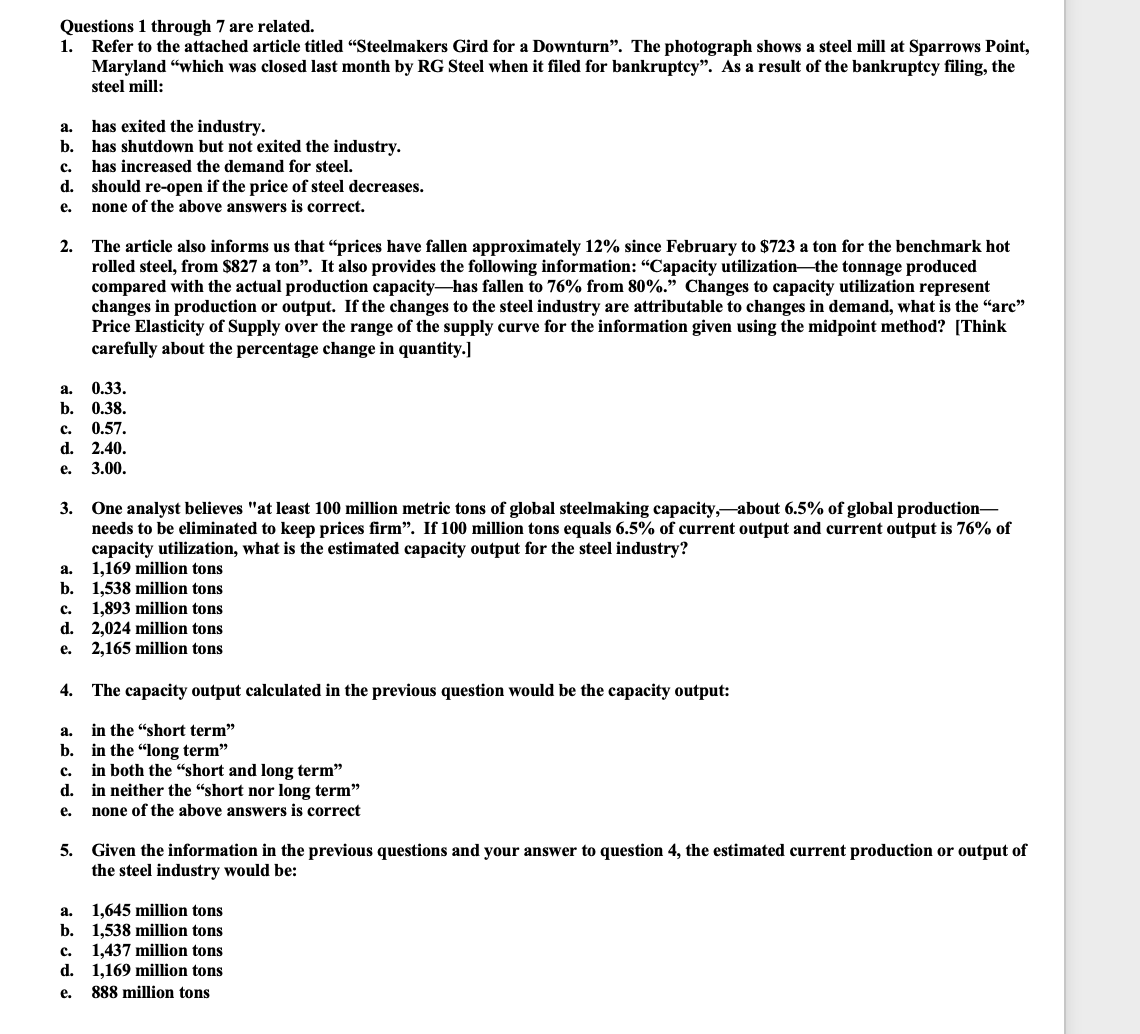
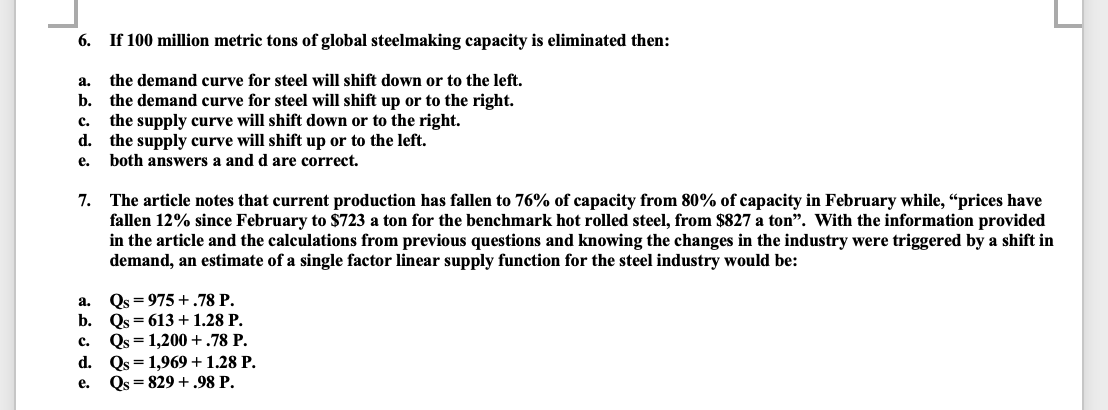
Questions 1 through 7 are related. 1. as??? H u w as??? e sever w 999?? 999;? Refer to the attached article titled \"Steelmakers Gird for a Downturn\". The photograph shows a steel mill at Sparrows Point, Maryland \"which was closed last month by RC Steel when it filed for bankruptcy\". As a result of the bankruptcy filing, the steel mill: has exited the industry. has shutdown but not exited the industry. has increased the demand for steel. should re-open if the price of steel decreases. none of the above answers is correct. The article also informs us that \"prices have fallen approximately 12% since February to $723 a ton for the benchmark hot rolled steel, from $827 a ton\". It also provides the following information: \"Capacity utilizationthe tonnage produced compared with the actual production capacityhas fallen to 76% from 80%.\" Changes to capacity utilization represent changes in production or output. If the changes to the steel industry are attributable to changes in demand, what is the \"arc\" Price Elasticity of Supply over the range of the supply curve for the information given using the midpoint method? [Think carefully about the percentage change in quantity.] 0.33. 0.38. 0.57. 2.40. 3.00. One analyst believes "at least 100 million metric tons of global steelmaking capacity,about 6.5% of global production needs to be eliminated to keep prices rm\". If 100 million tons equals 6.5% of current output and current output is 76% of capacity utilintion, what is the estimated capacity output for the steel industry? 1,169 million tons 1,538 million tons 1,893 million tons 2,024 million tons 2,165 million tons The capacity output calculated in the previous question would be the capacity output: in the \"short term\" in the \"long term\" in both the \"short and long term\" in neither the \"short nor long term\" none of the above answers is correct Given the information in the previous questions and your answer to question 4, the estimated current production or output of the steel industry would be: 1,645 million tons 1,538 million tons 1,437 million tons 1,169 million tons 888 million tons 6. If 100 million metric tons of global steelmaking capacity is eliminated then: a. the demand curve for steel will shift down or to the left. b. the demand curve for steel will shift up or to the right. c. the supply curve will shift down or to the right. d. the supply curve will shift up or to the left. e. both answers a and d are correct. 7. The article notes that current production has fallen to 76% of capacity from 80% of capacity in February while, "prices have fallen 12% since February to $723 a ton for the benchmark hot rolled steel, from $827 a ton". With the information provided in the article and the calculations from previous questions and knowing the changes in the industry were triggered by a shift in demand, an estimate of a single factor linear supply function for the steel industry would be: a. Qs = 975 + .78 P. b. Qs = 613 + 1.28 P. C. Qs = 1,200 + .78 P. d. Qs = 1,969 + 1.28 P. e. Qs = 829 + .98 P


