

Answered step by step
Verified Expert Solution
Question
1 Approved Answer
Questions 3 : 3 . 1 . Discuss the six different output values that are provided by a Pivot Grid. 3 . 2 . Table
Questions :
Discuss the six different output values that are provided by a Pivot Grid.
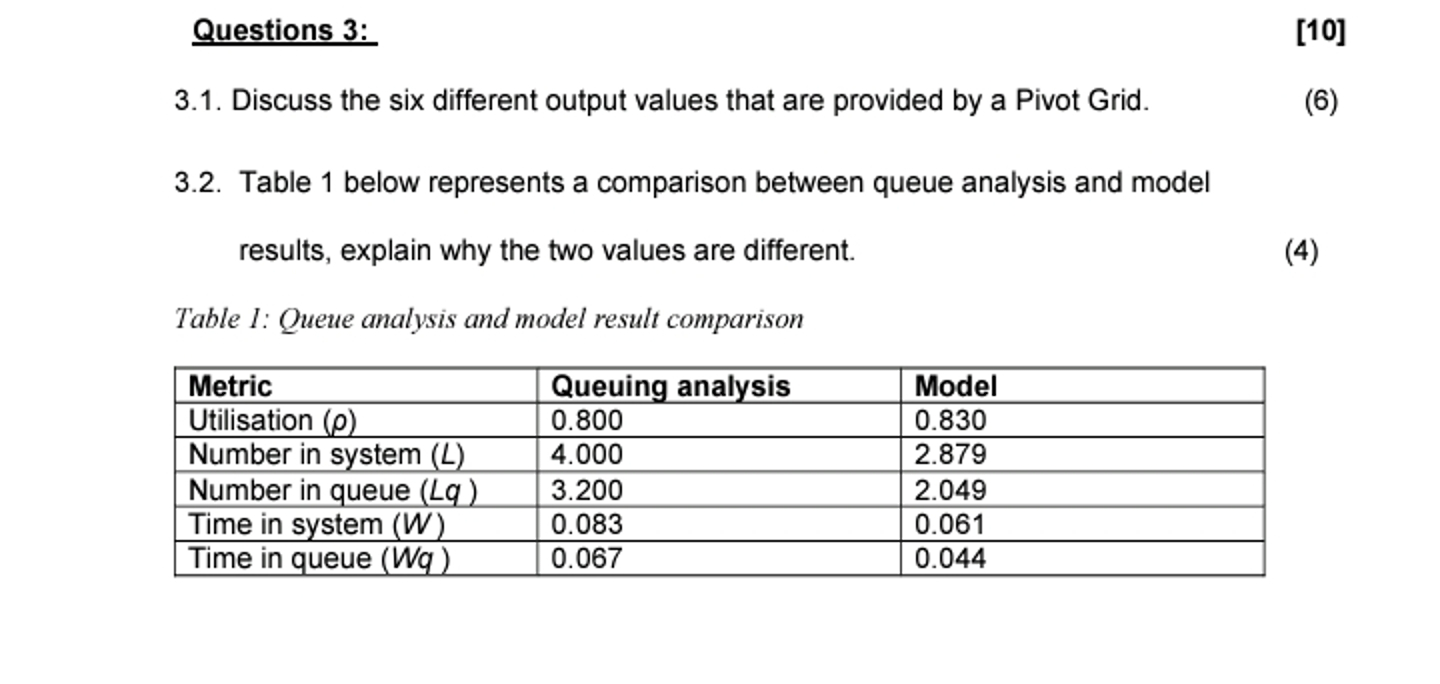
Table below represents a comparison between queue analysis and model
results, explain why the two values are different.
Table : Queue analysis and model result comparison
Step by Step Solution
There are 3 Steps involved in it
Step: 1

Get Instant Access to Expert-Tailored Solutions
See step-by-step solutions with expert insights and AI powered tools for academic success
Step: 2

Step: 3
Ace Your Homework with AI
Get the answers you need in no time with our AI-driven, step-by-step assistance
Get Started
Pro SQL Server Administration
Authors: Peter Carter
1st Edition
1484207106, 9781484207109