

Answered step by step
Verified Expert Solution
Question
1 Approved Answer
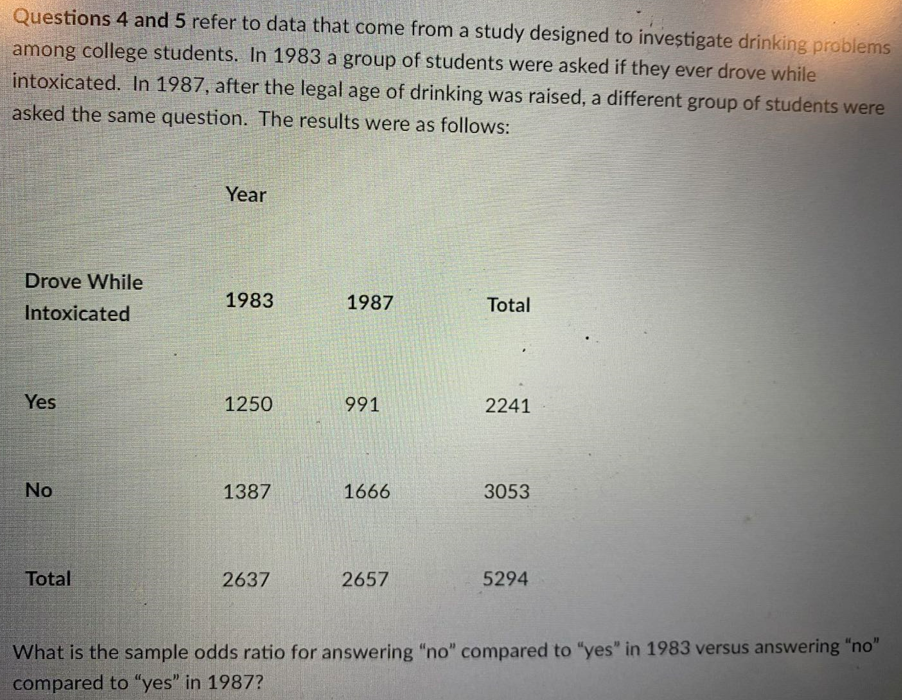
Questions 4 and 5 refer to data that come from a study designed to investigate drinking problems among college students. In 1983 a group of
Step by Step Solution
There are 3 Steps involved in it
Step: 1

Get Instant Access to Expert-Tailored Solutions
See step-by-step solutions with expert insights and AI powered tools for academic success
Step: 2

Step: 3
Ace Your Homework with AI
Get the answers you need in no time with our AI-driven, step-by-step assistance
Get Started
Precalculus, Enhanced WebAssign Edition
Authors: James Stewart
6th Edition
1285499948, 9781285499949