Answered step by step
Verified Expert Solution
Link Copied!

Question

1 Approved Answer

questions 5-8 please A researcher wants to investigate the relationship between health and economic development and downloads the following data for 20 countries on life

image text in transcribed
questions 5-8 please
A researcher wants to investigate the relationship between health and economic development and downloads the following data for 20 countries on life expectancy and GDP per capita in 2018. Country Bangladesh Belarus Belgium Benin Bolivia Italy Japan Jordan Kazakhstan Kenya Netherlands New Zealand Nicaragua Niger Nigeria United States Uruguay Uzbekistan Vietnam Zambia Life Expectancy at birth 73.4 74.3 81.5 64.9 73.1 83.3 84.4 79.5 72.5 66.3 81.7 81.8 79 62.8 64.8 78.6 77.2 70.5 74.6 63.7 GDP PC (PPP USD) 4440 18900 51200 3160 8660 42200 41100 9850 25500 4200 56500 42600 5690 1200 5160 61400 21600 6760 7590 3520 To cover in Week 10 5. Obtain the standard errors and the 95% confidence interval of the slope estimate. 6. Is the slope of the regression significantly different from zero at 1%? Interpret how this result affects your interpretation of the slope. 7. Test whether R2 is significantly different from zero at 5% level. 8. The researcher claims that governments should invest more in health as these results suggest that policies that increase life expectancy will generate an increase in GDP per capita. Do you agree? A researcher wants to investigate the relationship between health and economic development and downloads the following data for 20 countries on life expectancy and GDP per capita in 2018. Country Bangladesh Belarus Belgium Benin Bolivia Italy Japan Jordan Kazakhstan Kenya Netherlands New Zealand Nicaragua Niger Nigeria United States Uruguay Uzbekistan Vietnam Zambia Life Expectancy at birth 73.4 74.3 81.5 64.9 73.1 83.3 84.4 79.5 72.5 66.3 81.7 81.8 79 62.8 64.8 78.6 77.2 70.5 74.6 63.7 GDP PC (PPP USD) 4440 18900 51200 3160 8660 42200 41100 9850 25500 4200 56500 42600 5690 1200 5160 61400 21600 6760 7590 3520 To cover in Week 10 5. Obtain the standard errors and the 95% confidence interval of the slope estimate. 6. Is the slope of the regression significantly different from zero at 1%? Interpret how this result affects your interpretation of the slope. 7. Test whether R2 is significantly different from zero at 5% level. 8. The researcher claims that governments should invest more in health as these results suggest that policies that increase life expectancy will generate an increase in GDP per capita. Do you agree

Step by Step Solution

There are 3 Steps involved in it

Step: 1

blur-text-image

Get Instant Access to Expert-Tailored Solutions

See step-by-step solutions with expert insights and AI powered tools for academic success

Step: 2

blur-text-image

Step: 3

blur-text-image

Ace Your Homework with AI

Get the answers you need in no time with our AI-driven, step-by-step assistance

Get Started

Recommended Textbook for

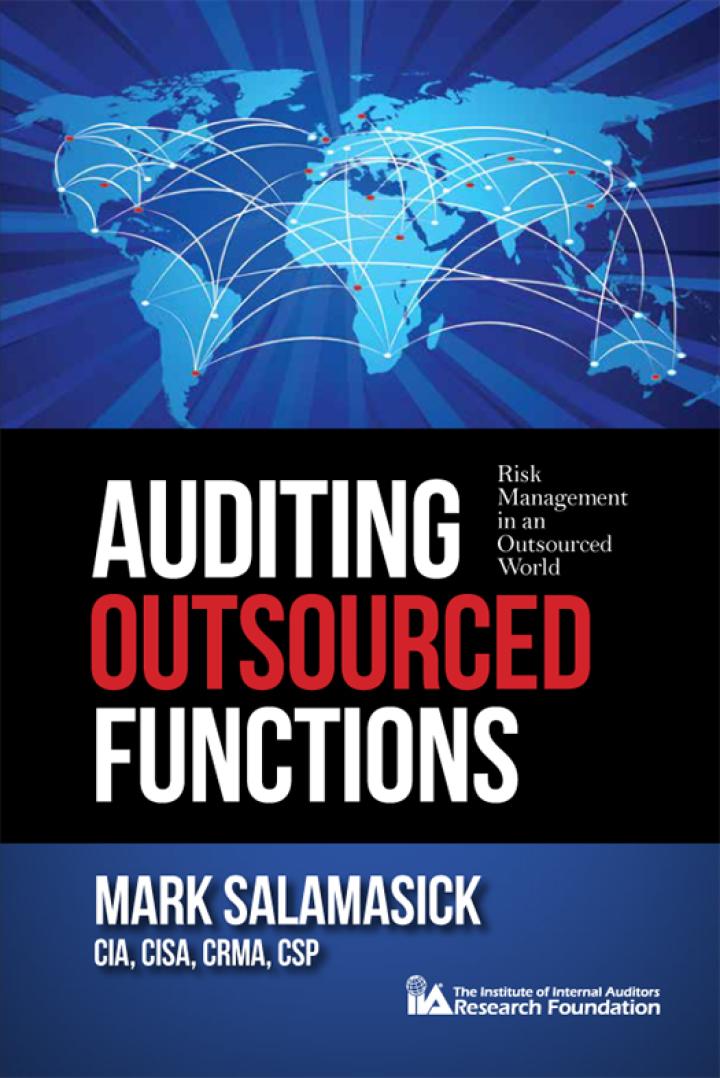
Auditing Outsourced Functions Risk Management In An Outsourced World

Authors: Mark Salamasick

1st Edition

0894137255, 9780894137259

More Books

Students also viewed these Accounting questions