Answered step by step
Verified Expert Solution
Link Copied!

Question

1 Approved Answer

Questions a & b Financial analysts who make forecasts of stock prices are categorized as either buy-side analysts or sell-side analysts. The mean and standard

Questions a & b
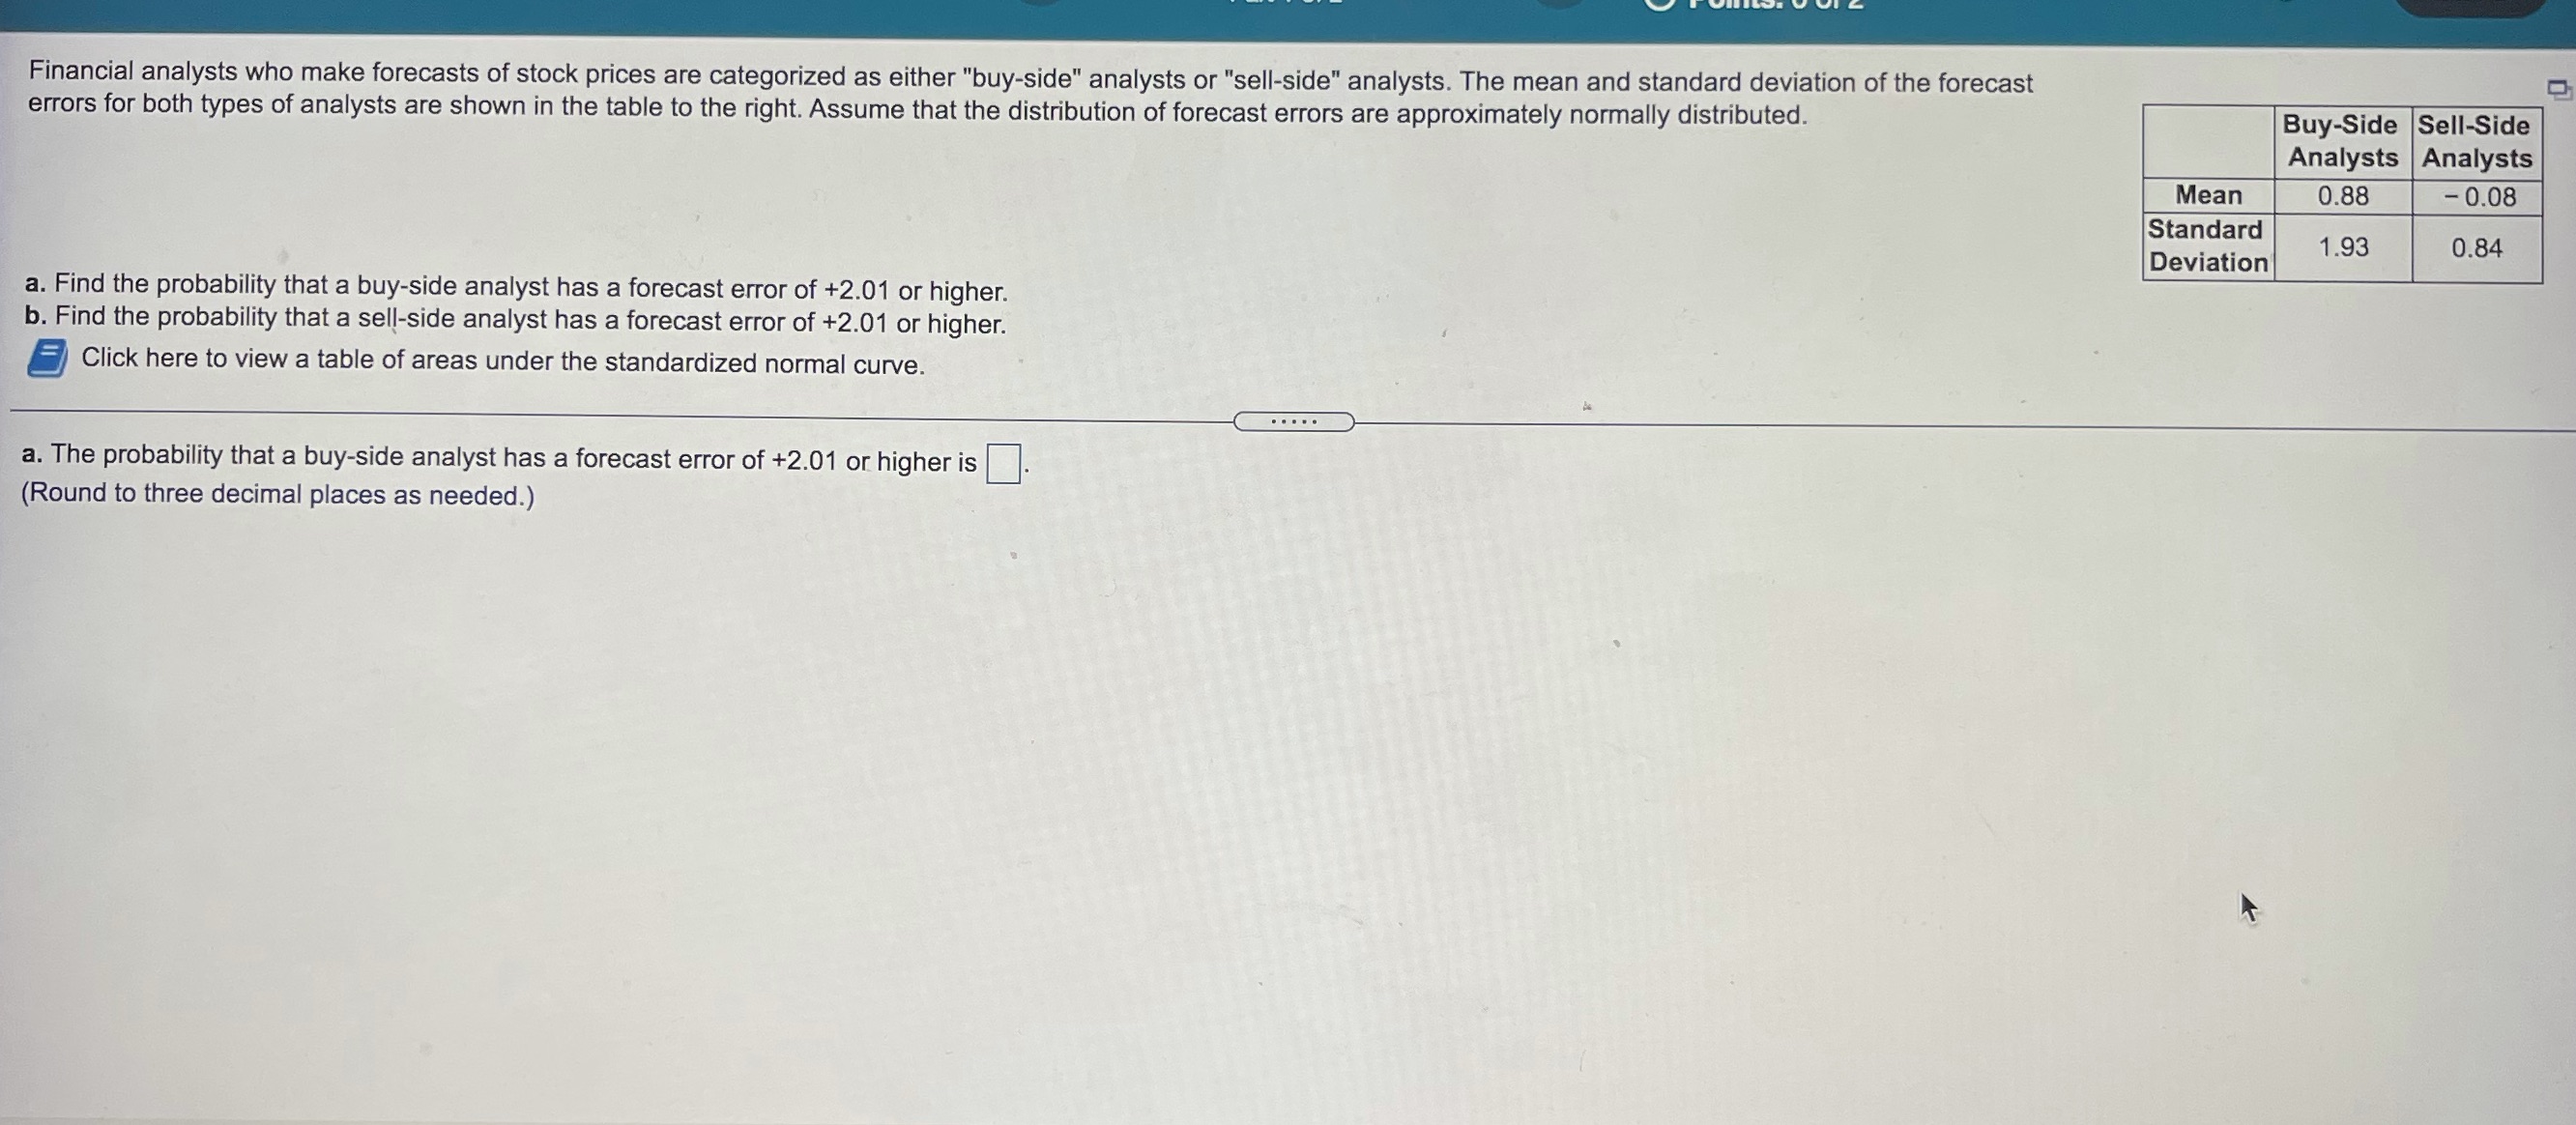
image text in transcribed
Financial analysts who make forecasts of stock prices are categorized as either "buy-side" analysts or "sell-side" analysts. The mean and standard deviation of the forecast errors for both types of analysts are shown in the table to the right. Assume that the distribution of forecast errors are approximately normally distributed. Buy-Side Sell-Side Analysts Analysts Mean 0.88 - 0.08 Standard Deviation 1.93 0.84 a. Find the probability that a buy-side analyst has a forecast error of +2.01 or higher. b. Find the probability that a sell-side analyst has a forecast error of +2.01 or higher. Click here to view a table of areas under the standardized normal curve. . . . . . a. The probability that a buy-side analyst has a forecast error of +2.01 or higher is (Round to three decimal places as needed.)

Step by Step Solution

There are 3 Steps involved in it

Step: 1

blur-text-image

Get Instant Access to Expert-Tailored Solutions

See step-by-step solutions with expert insights and AI powered tools for academic success

Step: 2

blur-text-image

Step: 3

blur-text-image

Ace Your Homework with AI

Get the answers you need in no time with our AI-driven, step-by-step assistance

Get Started

Recommended Textbook for

Algebra And Trigonometry, Enhanced

Authors: Cynthia Y Young

4th Edition

1119320860, 9781119320869

More Books

Students also viewed these Mathematics questions