Answered step by step
Verified Expert Solution
Question
1 Approved Answer
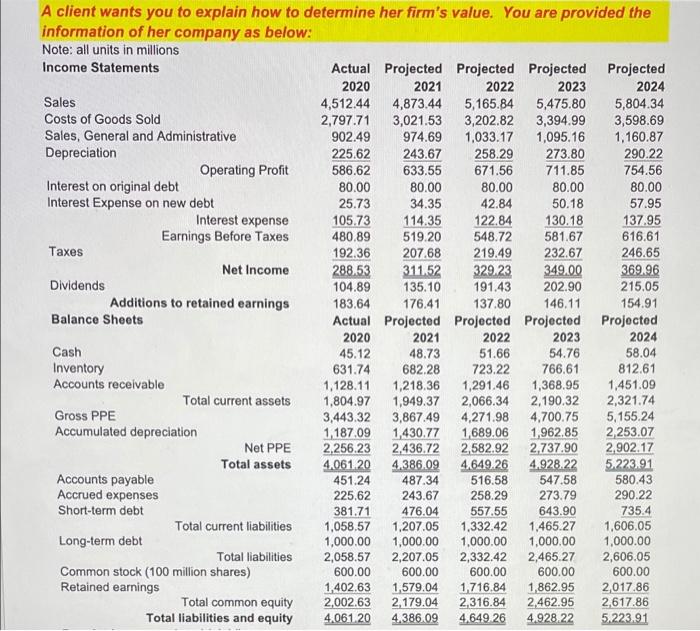
questions are in second image A client wants you to explain how to determine her firm's value. You are provided the information of her company
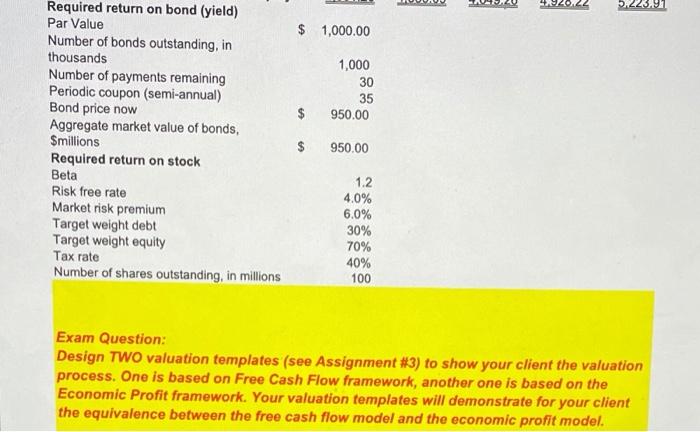
questions are in second image 

A client wants you to explain how to determine her firm's value. You are provided the information of her company as below: Note: all units in millions Income Statements Actual Projected Projected Projected Projected 2020 2021 2022 2023 2024 Sales 4,512.44 4,873.44 5,165.84 5,475.80 5,804.34 Costs of Goods Sold 2,797.71 3,021.53 3,202.82 3,394.99 3,598.69 Sales, General and Administrative 902.49 974.69 1,033.17 1,095.16 1,160.87 Depreciation 225.62 243.67 258.29 273.80 290.22 Operating Profit 586.62 633.55 671.56 711.85 754.56 Interest on original debt 80.00 80.00 80.00 80.00 80.00 Interest Expense on new debt 25.73 34.35 42.84 50.18 57.95 Interest expense 105.73 114.35 122.84 130.18 137.95 Earnings Before Taxes 480.89 519.20 548.72 581.67 616.61 Taxes 192.36 207,68 219.49 232.67 246.65 Net Income 288.53 311.52 329.23 349.00 369.96 Dividends 104.89 135.10 191.43 202.90 215.05 Additions to retained earnings 183.64 176.41 137.80 146.11 154.91 Balance Sheets Actual Projected Projected Projected Projected 2021 2022 2023 2024 Cash 45.12 48.73 51.66 54.76 58.04 Inventory 631.74 682.28 723.22 766.61 812.61 Accounts receivable 1,128.11 1,218,36 1,291,46 1,368.95 1,451.09 Total current assets 1,804.97 1,949.37 2,066.34 2,190.32 2,321.74 Gross PPE 3,443.32 3,867,49 4,271.98 4.700.75 5,155.24 Accumulated depreciation 1,187.09 1,430.77 1,689.06 1,962,85 2,253,07 Net PPE 2,256.23 2,436.72 2,582.92 2,737.90 2,902.17 Total assets 4.061.20 4.386.09 4,649.26 4.928.22 5.223.91 Accounts payable 451.24 487.34 516.58 547.58 580.43 Accrued expenses 225,62 243.67 258.29 273.79 290.22 Short-term debt 381.71 476.04 557.55 643.90 735.4 Total current liabilities 1,058.57 1,207.05 1,332.42 1,465.27 1,606.05 Long-term debt 1,000.00 1,000.00 1,000.00 1,000.00 1,000.00 Total liabilities 2,058.57 2,207.05 2,332.42 2,465.27 2,606.05 Common stock (100 million shares) 600.00 600.00 600.00 600.00 600.00 Retained earnings 1,402.63 1,579.04 1.716.84 1,862.95 2017.86 Total common equity 2,002.63 2,179.04 2,316.84 2.462.95 2,617.86 Total liabilities and equity 4.061.20 4.386.09 4.649 26 4.928.22 5.223.91 2020 5.223.97 $ 1,000.00 1,000 30 35 950.00 Required return on bond (yield) Par Value Number of bonds outstanding, in thousands Number of payments remaining Periodic coupon (semi-annual) Bond price now Aggregate market value of bonds, Smillions Required return on stock Beta Risk free rate Market risk premium Target weight debt Target weight equity Tax rate Number of shares outstanding, in millions $ 950.00 1.2 4.0% 6.0% 30% 70% 40% 100 Exam Question: Design TWO valuation templates (see Assignment #3) to show your client the valuation process. One is based on Free Cash Flow framework, another one is based on the Economic Profit framework. Your valuation templates will demonstrate for your client the equivalence between the free cash flow model and the economic profit model. A client wants you to explain how to determine her firm's value. You are provided the information of her company as below: Note: all units in millions Income Statements Actual Projected Projected Projected Projected 2020 2021 2022 2023 2024 Sales 4,512.44 4,873.44 5,165.84 5,475.80 5,804.34 Costs of Goods Sold 2,797.71 3,021.53 3,202.82 3,394.99 3,598.69 Sales, General and Administrative 902.49 974.69 1,033.17 1,095.16 1,160.87 Depreciation 225.62 243.67 258.29 273.80 290.22 Operating Profit 586.62 633.55 671.56 711.85 754.56 Interest on original debt 80.00 80.00 80.00 80.00 80.00 Interest Expense on new debt 25.73 34.35 42.84 50.18 57.95 Interest expense 105.73 114.35 122.84 130.18 137.95 Earnings Before Taxes 480.89 519.20 548.72 581.67 616.61 Taxes 192.36 207,68 219.49 232.67 246.65 Net Income 288.53 311.52 329.23 349.00 369.96 Dividends 104.89 135.10 191.43 202.90 215.05 Additions to retained earnings 183.64 176.41 137.80 146.11 154.91 Balance Sheets Actual Projected Projected Projected Projected 2021 2022 2023 2024 Cash 45.12 48.73 51.66 54.76 58.04 Inventory 631.74 682.28 723.22 766.61 812.61 Accounts receivable 1,128.11 1,218,36 1,291,46 1,368.95 1,451.09 Total current assets 1,804.97 1,949.37 2,066.34 2,190.32 2,321.74 Gross PPE 3,443.32 3,867,49 4,271.98 4.700.75 5,155.24 Accumulated depreciation 1,187.09 1,430.77 1,689.06 1,962,85 2,253,07 Net PPE 2,256.23 2,436.72 2,582.92 2,737.90 2,902.17 Total assets 4.061.20 4.386.09 4,649.26 4.928.22 5.223.91 Accounts payable 451.24 487.34 516.58 547.58 580.43 Accrued expenses 225,62 243.67 258.29 273.79 290.22 Short-term debt 381.71 476.04 557.55 643.90 735.4 Total current liabilities 1,058.57 1,207.05 1,332.42 1,465.27 1,606.05 Long-term debt 1,000.00 1,000.00 1,000.00 1,000.00 1,000.00 Total liabilities 2,058.57 2,207.05 2,332.42 2,465.27 2,606.05 Common stock (100 million shares) 600.00 600.00 600.00 600.00 600.00 Retained earnings 1,402.63 1,579.04 1.716.84 1,862.95 2017.86 Total common equity 2,002.63 2,179.04 2,316.84 2.462.95 2,617.86 Total liabilities and equity 4.061.20 4.386.09 4.649 26 4.928.22 5.223.91 2020 5.223.97 $ 1,000.00 1,000 30 35 950.00 Required return on bond (yield) Par Value Number of bonds outstanding, in thousands Number of payments remaining Periodic coupon (semi-annual) Bond price now Aggregate market value of bonds, Smillions Required return on stock Beta Risk free rate Market risk premium Target weight debt Target weight equity Tax rate Number of shares outstanding, in millions $ 950.00 1.2 4.0% 6.0% 30% 70% 40% 100 Exam Question: Design TWO valuation templates (see Assignment #3) to show your client the valuation process. One is based on Free Cash Flow framework, another one is based on the Economic Profit framework. Your valuation templates will demonstrate for your client the equivalence between the free cash flow model and the economic profit model 

Step by Step Solution
There are 3 Steps involved in it
Step: 1

Get Instant Access to Expert-Tailored Solutions
See step-by-step solutions with expert insights and AI powered tools for academic success
Step: 2

Step: 3

Ace Your Homework with AI
Get the answers you need in no time with our AI-driven, step-by-step assistance
Get Started


