Answered step by step
Verified Expert Solution
Link Copied!

Question

1 Approved Answer

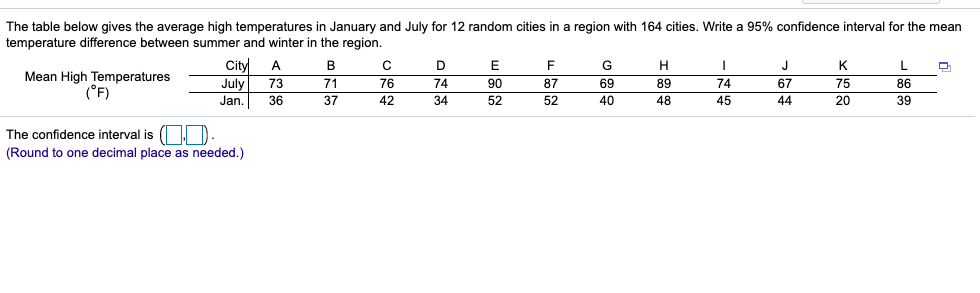
Questions attached The table below gives the average high temperatures in January and July for 12 random cities in a region with 164 cities. Write

Questions attached

image text in transcribedimage text in transcribedimage text in transcribed
The table below gives the average high temperatures in January and July for 12 random cities in a region with 164 cities. Write a 95% confidence interval for the mean temperature difference between summer and winter in the region. Mean High Temperatures City A B C D E F G ( " F ) July 73 71 76 H 74 90 87 J K L Jan. 36 37 69 89 42 34 74 67 52 52 75 40 86 48 45 44 The confidence interval is (].D) 20 39 (Round to one decimal place as needed.)Do these data suggest that there is a signicant difference in Calories-\"Sewing calories between servings of strawberry and vanilla yogurt? Test an Brand Strawberry appropriate hypothesis and state your conclusion. Don't forget to 1 210 check assumptions and conditions! Remove any outliers before 2 100 performing the test. 3 1m 4 110 5 120 E 130 Select appropriate hypotheses for testing. 0 A. Ho: There is a difference in calories between strawberry and vanilla yogurt. HA: There is no difference in calories between strawberry and vanilla yogurt 0 B. Ho: There is no difference in calories between strawberry and vanilla yogurt. H A: There is a difference in calories between strawberry and vanilla yogurt. 0 6. Ha: There is no difference in calories between strawberry and vanilla yogurt. HA: Strawberry yogurt has more calories than vanilla yogurt. Compute the test statistic. Use Strawberry Vanilla as the difference. The test statistic is |:|. [Round to three decimal places as needed.) Find the Pvalue. The Pvalue is D [Round to four decimal places as needed.) Vanilla 210 110 130 SD 140 140 Brand 10 11 12 Caloriesi'Serving Strawberry lv'anilla 200 140 130 150 140 130 120 150 130 150 160 1m % Researchers wanted to see if a certain image in ads affected people's ability to remember the item being advertised. They found two ads for each of 10 similar items, one with the image and one without Then they showed the ads to 10 randomly selected people for one minute and asked them to list as many of the items as they could. The results for the number of items remembered are shown in the table below. Is there evidence that the image mattered? Use or = 0.05. Bu bject 1 2 3 4 5 6 7 I! 9 10 g. Image 1 5 5 E 4 6 3 6 3 1 No image I [l 3 5 B 4 E 4 5 4 3 Identify the null and alternative hypotheses. Choose the correct answer below. A. H0:|,Ld=[l OB. H0:|,Ld=[l Hzpdii Hzpdco OB. Hozpdii CID. Hozpd

Step by Step Solution

There are 3 Steps involved in it

Step: 1

blur-text-image

Get Instant Access to Expert-Tailored Solutions

See step-by-step solutions with expert insights and AI powered tools for academic success

Step: 2

blur-text-image

Step: 3

blur-text-image

Ace Your Homework with AI

Get the answers you need in no time with our AI-driven, step-by-step assistance

Get Started

Recommended Textbook for

Mathematical Applications for the Management Life and Social Sciences

Authors: Ronald J. Harshbarger, James J. Reynolds

11th edition

9781337032247, 9781305465183, 1305108043, 1337032247, 1305465180, 978-1305108042

More Books

Students also viewed these Mathematics questions