Answered step by step
Verified Expert Solution
Question
1 Approved Answer
Questions for NX-Y, Z-Y, & IS-LM part of the model - There are 2 graphing questions, each on its own slide. 15 points each -
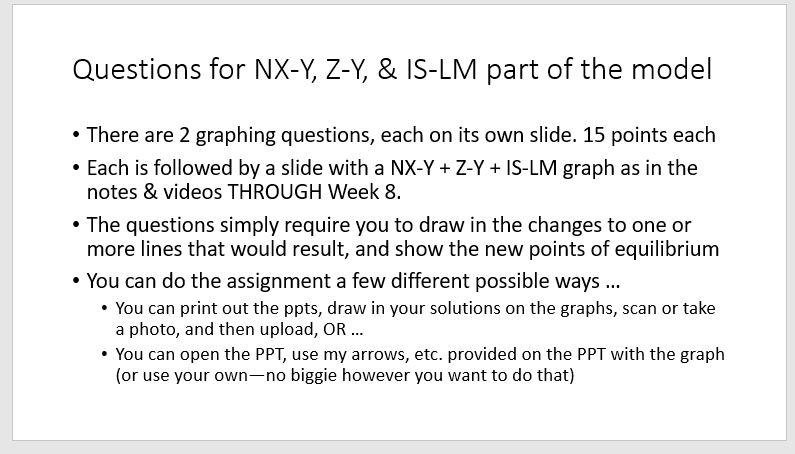
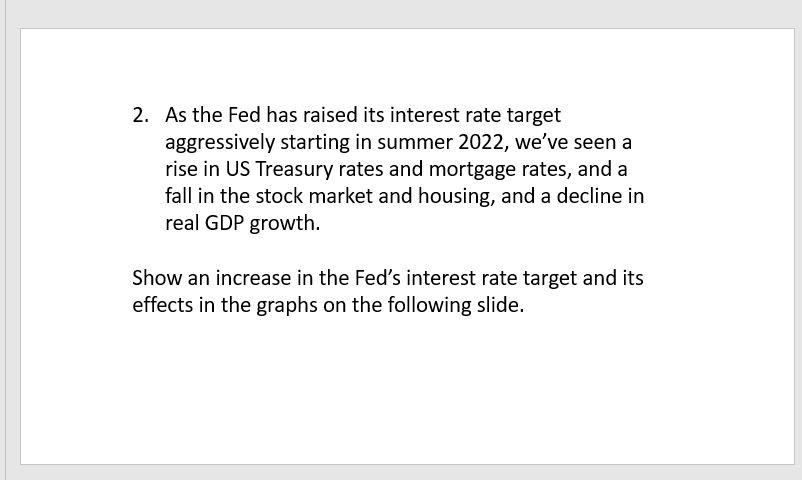
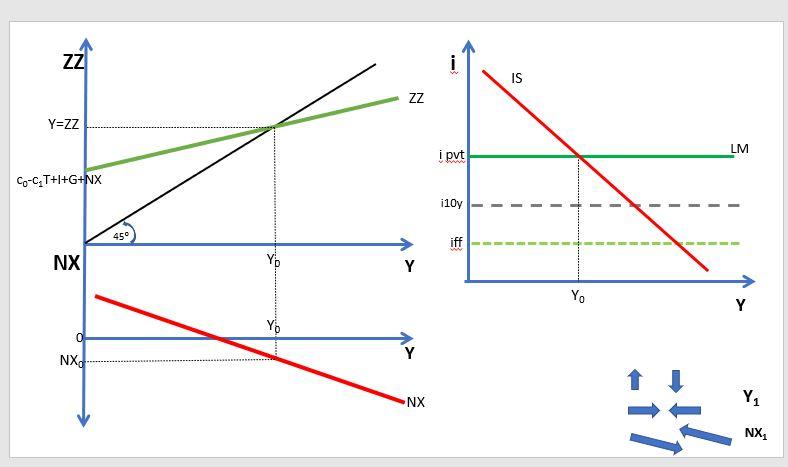
Questions for NX-Y, Z-Y, \& IS-LM part of the model - There are 2 graphing questions, each on its own slide. 15 points each - Each is followed by a slide with a NX-Y + Z-Y + IS-LM graph as in the notes \& videos THROUGH Week 8. - The questions simply require you to draw in the changes to one or more lines that would result, and show the new points of equilibrium - You can do the assignment a few different possible ways ... - You can print out the ppts, draw in your solutions on the graphs, scan or take a photo, and then upload, OR ... - You can open the PPT, use my arrows, etc. provided on the PPT with the graph (or use your own-no biggie however you want to do that) 2. As the Fed has raised its interest rate target aggressively starting in summer 2022 , we've seen a rise in US Treasury rates and mortgage rates, and a fall in the stock market and housing, and a decline in real GDP growth. Show an increase in the Fed's interest rate target and its effects in the graphs on the following slide. Questions for NX-Y, Z-Y, \& IS-LM part of the model - There are 2 graphing questions, each on its own slide. 15 points each - Each is followed by a slide with a NX-Y + Z-Y + IS-LM graph as in the notes \& videos THROUGH Week 8. - The questions simply require you to draw in the changes to one or more lines that would result, and show the new points of equilibrium - You can do the assignment a few different possible ways ... - You can print out the ppts, draw in your solutions on the graphs, scan or take a photo, and then upload, OR ... - You can open the PPT, use my arrows, etc. provided on the PPT with the graph (or use your own-no biggie however you want to do that) 2. As the Fed has raised its interest rate target aggressively starting in summer 2022 , we've seen a rise in US Treasury rates and mortgage rates, and a fall in the stock market and housing, and a decline in real GDP growth. Show an increase in the Fed's interest rate target and its effects in the graphs on the following slide
Step by Step Solution
There are 3 Steps involved in it
Step: 1
Get Instant Access to Expert-Tailored Solutions
See step-by-step solutions with expert insights and AI powered tools for academic success
Step: 2
Step: 3
Ace Your Homework with AI
Get the answers you need in no time with our AI-driven, step-by-step assistance
Get Started