Questions for the case
- Assess each distribution strategy from a qualitative point of view
- Identify all costs, other than variable costs, for the trade show distribution strategy.
- If the partners decide not to attend trade shows, what is the total available increased amount for the online marketing campaign for FY2014/15?
- Do the variable costs for both products (necklaces and pair of earrings) differ between trade shows and online sales?
- Calculate the variable cost per order incurred at a trade show and the variable costs incurred per online order
- For each distribution strategy calculate the unit contribution and contribution margin rate for each of the two product lines. What is the weighted average contribution margin rate for an order at a trade show and for an online order?
- Calculate Foxys breakeven point for each distribution strategy
- Which distribution channel is projected to be more profitable in 2015?
- As Ger and Chemel, what is your decision? Why?
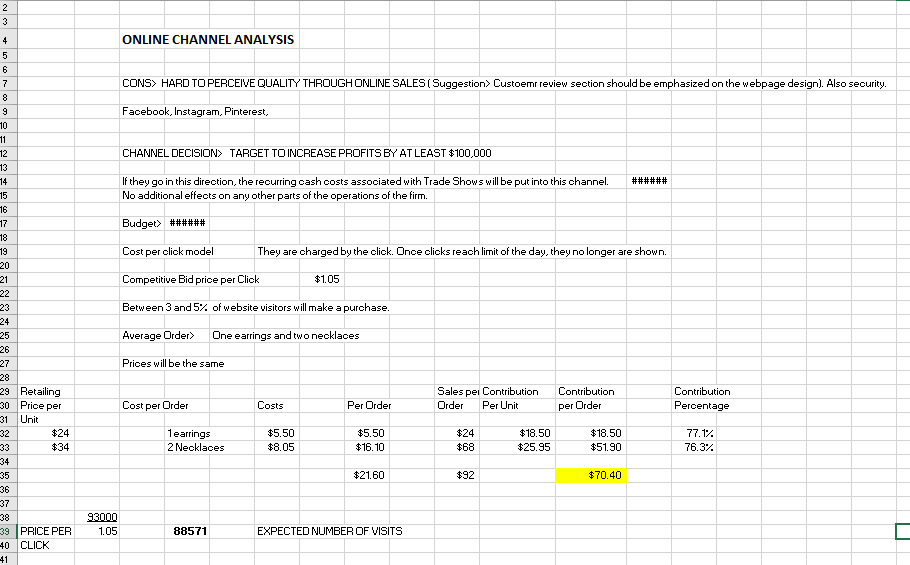
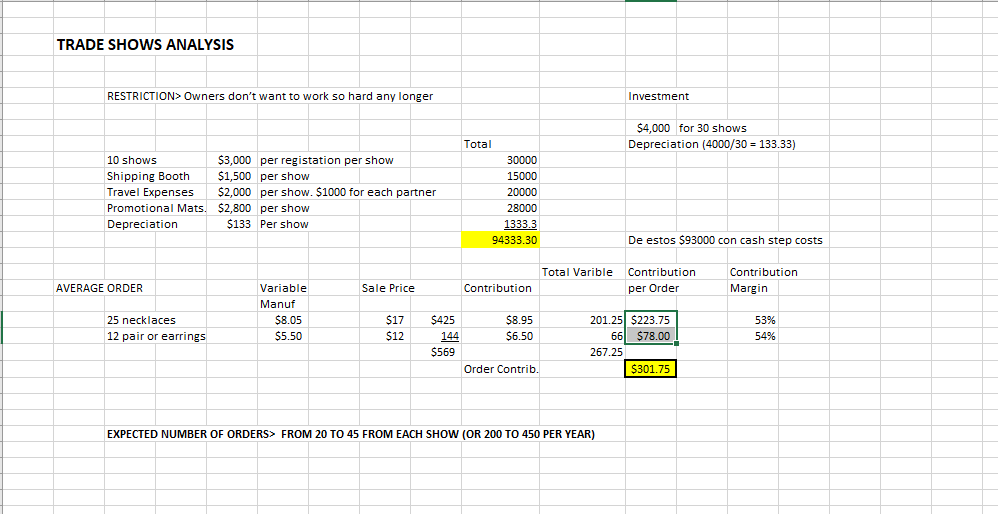
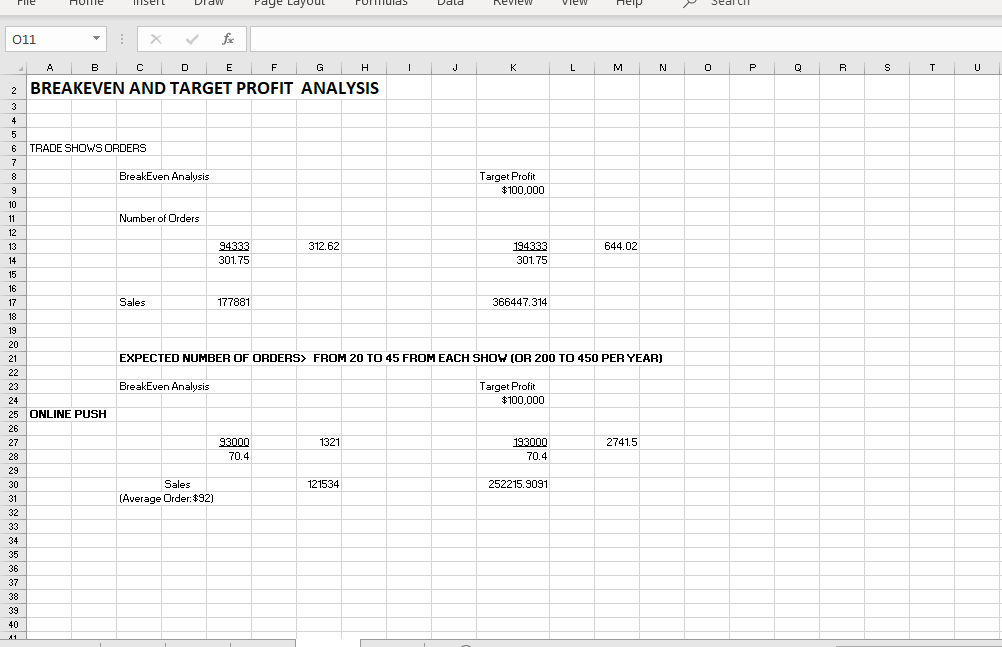
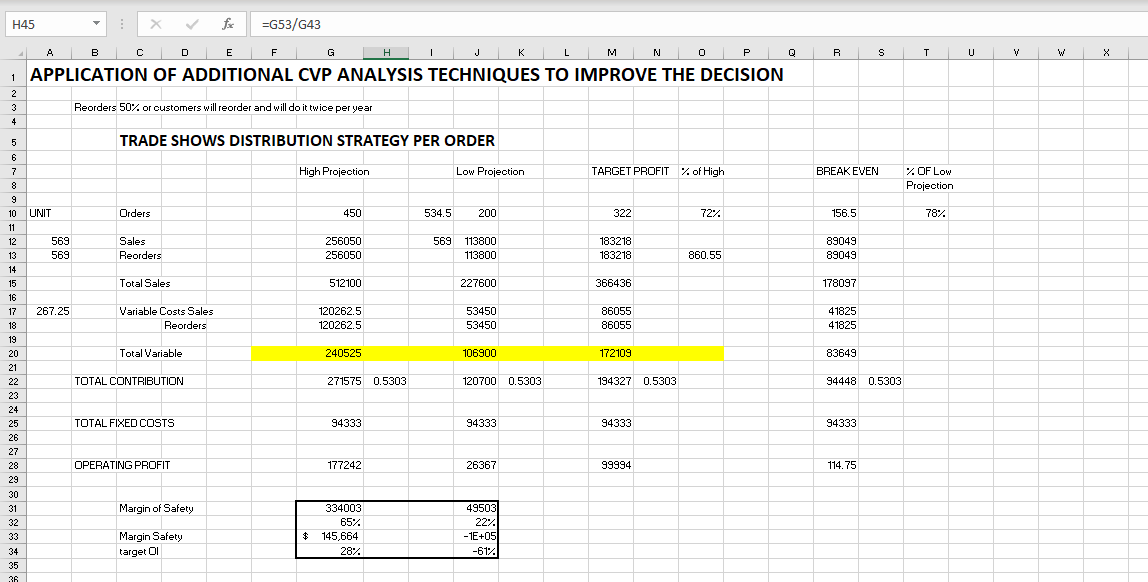
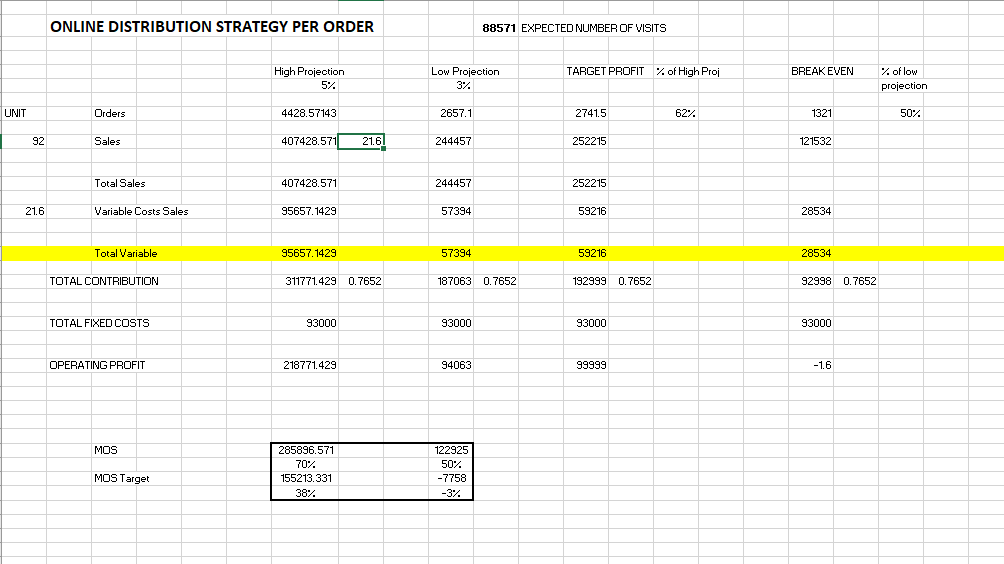
ONLINE CHANNEL ANALYSIS CONS> HARD TO PERCEIVE QUALITY THROUGH ONLINE SALES Suggestion> Custoemr review section should be emphasized on the webpage design). Also security. Facebook, Instagram, Pinterest CHANNEL DECISION> TARGET TO INCREASE PROFITS BY AT LEAST $100,000 If they go in this direction, the recurring cash costs associated with Trade Shows will be put into this channel. No additional effects on any other parts of the operations of the firm. Budget> # ##### Cost per click model They are charged by the click. Once clicks reach limit of the day, they no longer are shown Competitive Bid price per Click $1.05 Between 3 and 5% of website visitors will make a purchase. Average Order One earrings and two necklaces Prices will be the same 29 Retailing 30 Price per 31 Unit Sales pei Contribution Order Per Unit Contribution per Order Cost per Order Contribution Percentage Costs Per Order $24 1earrings 2 Necklaces $5.50 $8.05 $5.50 $16.10 $24 $68 $18.50 $25.95 $18.50 $51.90 77.1% 76.3% $34 $21.60 $92 $70.40 93000 105 88571 EXPECTED NUMBER OF VISITS 39 PRICE PER 40 CLICK TRADE SHOWS ANALYSIS RESTRICTION> Owners don't want to work so hard any longer Investment $4,000 for 30 shows Depreciation (4000/30 = 133.33) 10 shows $3,000 per registation per show Shipping Booth $1,500 per show Travel Expenses $2,000 per show. $1000 for each partner Promotional Mats. $2,800 per show Depreciation $133 Per show Total 30000 15000 20000 28000 1333.3 94333.30 De estos $93000 con cash step costs Total Varible Contribution per Order Contribution Margin AVERAGE ORDER Sale Price Contribution Variable Manuf $8.05 $5.50 $17 25 necklaces 12 pair or earrings $425 144 $569 $8.95 $6.50 53% 54% $12 201.25 $223.75 66 $78.00 267.25 $301.75 Order Contrib. EXPECTED NUMBER OF ORDERS FROM 20 TO 45 FROM EACH SHOW (OR 200 TO 450 PER YEAR) File Une sert DiaW Paye Layout PUITUlds Dald Review view help Sedl CII 011 - X Fax A B C D E F G H 2 BREAKEVEN AND TARGET PROFIT ANALYSIS I J K L M N O P Q R S T U 6 TRADE SHOWS ORDERS BreakEven Analysis Target Profit $100,000 Number of Orders 312.62 644.02 94333 301.75 194333 301.75 Sales 177881 366447.314 EXPECTED NUMBER OF ORDERS> FROM 20 TO 45 FROM EACH SHOW (OR 200 TO 450 PER YEAR) BreakEven Analysis Target Profit $100,000 25 ONLINE PUSH 1321 2741.5 93000 70.4 193000 70.4 121534 252215.9091 Sales (Average Order: $92) H45 : X for =G53/G43 41 A B C D E F G H I J K L M N O P 1 APPLICATION OF ADDITIONAL CVP ANALYSIS TECHNIQUES TO IMPROVE THE DECISION Q R S T U V W X Reorders 50% or customers will reorder and will do it twice per year TRADE SHOWS DISTRIBUTION STRATEGY PER ORDER High Projection Low Projection TARGET PROFIT % of High BREAK EVEN OF Low Projection 10 UNIT Orders 450 534.5 200 322 72% 156.5 782 12 569 569 569 Sales Reorders 256050 256050 113800 113800 183218 183218 860.55 89049 89049 Total Sales 512100 227600 366436 178097 267.25 Variable Costs Sales Reorders 120262.5 120262.5 53450 53450 86055 86055 41825 41825 Total Variable 240525 106900 172109 83649 TOTAL CONTRIBUTION 271575 0.5303 120700 0.5303 194327 0.5303 94448 0.5303 TOTAL FIXED COSTS 94333 94333 94333 94333 OPERATING PROFIT 177242 26367 99994 114.75 Margin of Safety 334003 65% 145,664 28% 49503 2222 -1E+05 -612 $ Margin Safety target OI ONLINE DISTRIBUTION STRATEGY PER ORDER 88571 EXPECTED NUMBER OF VISITS High Projection TARGET PROFIT % of High Proj BREAK EVEN Low Projection 37. % of low projection 5%. UNIT Orders 4428.57143 2657.1 2741.5 62% 1321 50% 92 Sales 407428.571 21.61 244457 252215 121532 Total Sales 407428.571 244457 252215 21.6 Variable Costs Sales 95657.1429 57394 59216 28534 Total Variable 95657.1429 57394 59216 28534 TOTAL CONTRIBUTION 311771.429 0.7652 187063 0.7652 192999 0.7652 92998 0.7652 TOTAL FIXED COSTS 93000 93000 93000 93000 OPERATING PROFIT 218771.429 94063 99999 -16 MOS 285896.571 70% 155213.331 38%. 122925 50% -7758 MOS Target ONLINE CHANNEL ANALYSIS CONS> HARD TO PERCEIVE QUALITY THROUGH ONLINE SALES Suggestion> Custoemr review section should be emphasized on the webpage design). Also security. Facebook, Instagram, Pinterest CHANNEL DECISION> TARGET TO INCREASE PROFITS BY AT LEAST $100,000 If they go in this direction, the recurring cash costs associated with Trade Shows will be put into this channel. No additional effects on any other parts of the operations of the firm. Budget> # ##### Cost per click model They are charged by the click. Once clicks reach limit of the day, they no longer are shown Competitive Bid price per Click $1.05 Between 3 and 5% of website visitors will make a purchase. Average Order One earrings and two necklaces Prices will be the same 29 Retailing 30 Price per 31 Unit Sales pei Contribution Order Per Unit Contribution per Order Cost per Order Contribution Percentage Costs Per Order $24 1earrings 2 Necklaces $5.50 $8.05 $5.50 $16.10 $24 $68 $18.50 $25.95 $18.50 $51.90 77.1% 76.3% $34 $21.60 $92 $70.40 93000 105 88571 EXPECTED NUMBER OF VISITS 39 PRICE PER 40 CLICK TRADE SHOWS ANALYSIS RESTRICTION> Owners don't want to work so hard any longer Investment $4,000 for 30 shows Depreciation (4000/30 = 133.33) 10 shows $3,000 per registation per show Shipping Booth $1,500 per show Travel Expenses $2,000 per show. $1000 for each partner Promotional Mats. $2,800 per show Depreciation $133 Per show Total 30000 15000 20000 28000 1333.3 94333.30 De estos $93000 con cash step costs Total Varible Contribution per Order Contribution Margin AVERAGE ORDER Sale Price Contribution Variable Manuf $8.05 $5.50 $17 25 necklaces 12 pair or earrings $425 144 $569 $8.95 $6.50 53% 54% $12 201.25 $223.75 66 $78.00 267.25 $301.75 Order Contrib. EXPECTED NUMBER OF ORDERS FROM 20 TO 45 FROM EACH SHOW (OR 200 TO 450 PER YEAR) File Une sert DiaW Paye Layout PUITUlds Dald Review view help Sedl CII 011 - X Fax A B C D E F G H 2 BREAKEVEN AND TARGET PROFIT ANALYSIS I J K L M N O P Q R S T U 6 TRADE SHOWS ORDERS BreakEven Analysis Target Profit $100,000 Number of Orders 312.62 644.02 94333 301.75 194333 301.75 Sales 177881 366447.314 EXPECTED NUMBER OF ORDERS> FROM 20 TO 45 FROM EACH SHOW (OR 200 TO 450 PER YEAR) BreakEven Analysis Target Profit $100,000 25 ONLINE PUSH 1321 2741.5 93000 70.4 193000 70.4 121534 252215.9091 Sales (Average Order: $92) H45 : X for =G53/G43 41 A B C D E F G H I J K L M N O P 1 APPLICATION OF ADDITIONAL CVP ANALYSIS TECHNIQUES TO IMPROVE THE DECISION Q R S T U V W X Reorders 50% or customers will reorder and will do it twice per year TRADE SHOWS DISTRIBUTION STRATEGY PER ORDER High Projection Low Projection TARGET PROFIT % of High BREAK EVEN OF Low Projection 10 UNIT Orders 450 534.5 200 322 72% 156.5 782 12 569 569 569 Sales Reorders 256050 256050 113800 113800 183218 183218 860.55 89049 89049 Total Sales 512100 227600 366436 178097 267.25 Variable Costs Sales Reorders 120262.5 120262.5 53450 53450 86055 86055 41825 41825 Total Variable 240525 106900 172109 83649 TOTAL CONTRIBUTION 271575 0.5303 120700 0.5303 194327 0.5303 94448 0.5303 TOTAL FIXED COSTS 94333 94333 94333 94333 OPERATING PROFIT 177242 26367 99994 114.75 Margin of Safety 334003 65% 145,664 28% 49503 2222 -1E+05 -612 $ Margin Safety target OI ONLINE DISTRIBUTION STRATEGY PER ORDER 88571 EXPECTED NUMBER OF VISITS High Projection TARGET PROFIT % of High Proj BREAK EVEN Low Projection 37. % of low projection 5%. UNIT Orders 4428.57143 2657.1 2741.5 62% 1321 50% 92 Sales 407428.571 21.61 244457 252215 121532 Total Sales 407428.571 244457 252215 21.6 Variable Costs Sales 95657.1429 57394 59216 28534 Total Variable 95657.1429 57394 59216 28534 TOTAL CONTRIBUTION 311771.429 0.7652 187063 0.7652 192999 0.7652 92998 0.7652 TOTAL FIXED COSTS 93000 93000 93000 93000 OPERATING PROFIT 218771.429 94063 99999 -16 MOS 285896.571 70% 155213.331 38%. 122925 50% -7758 MOS Target


