

Question
Questions from the graph attached: If the rate of change for Covid-19 is constant between June and October, determine the following a. Approximate the slope
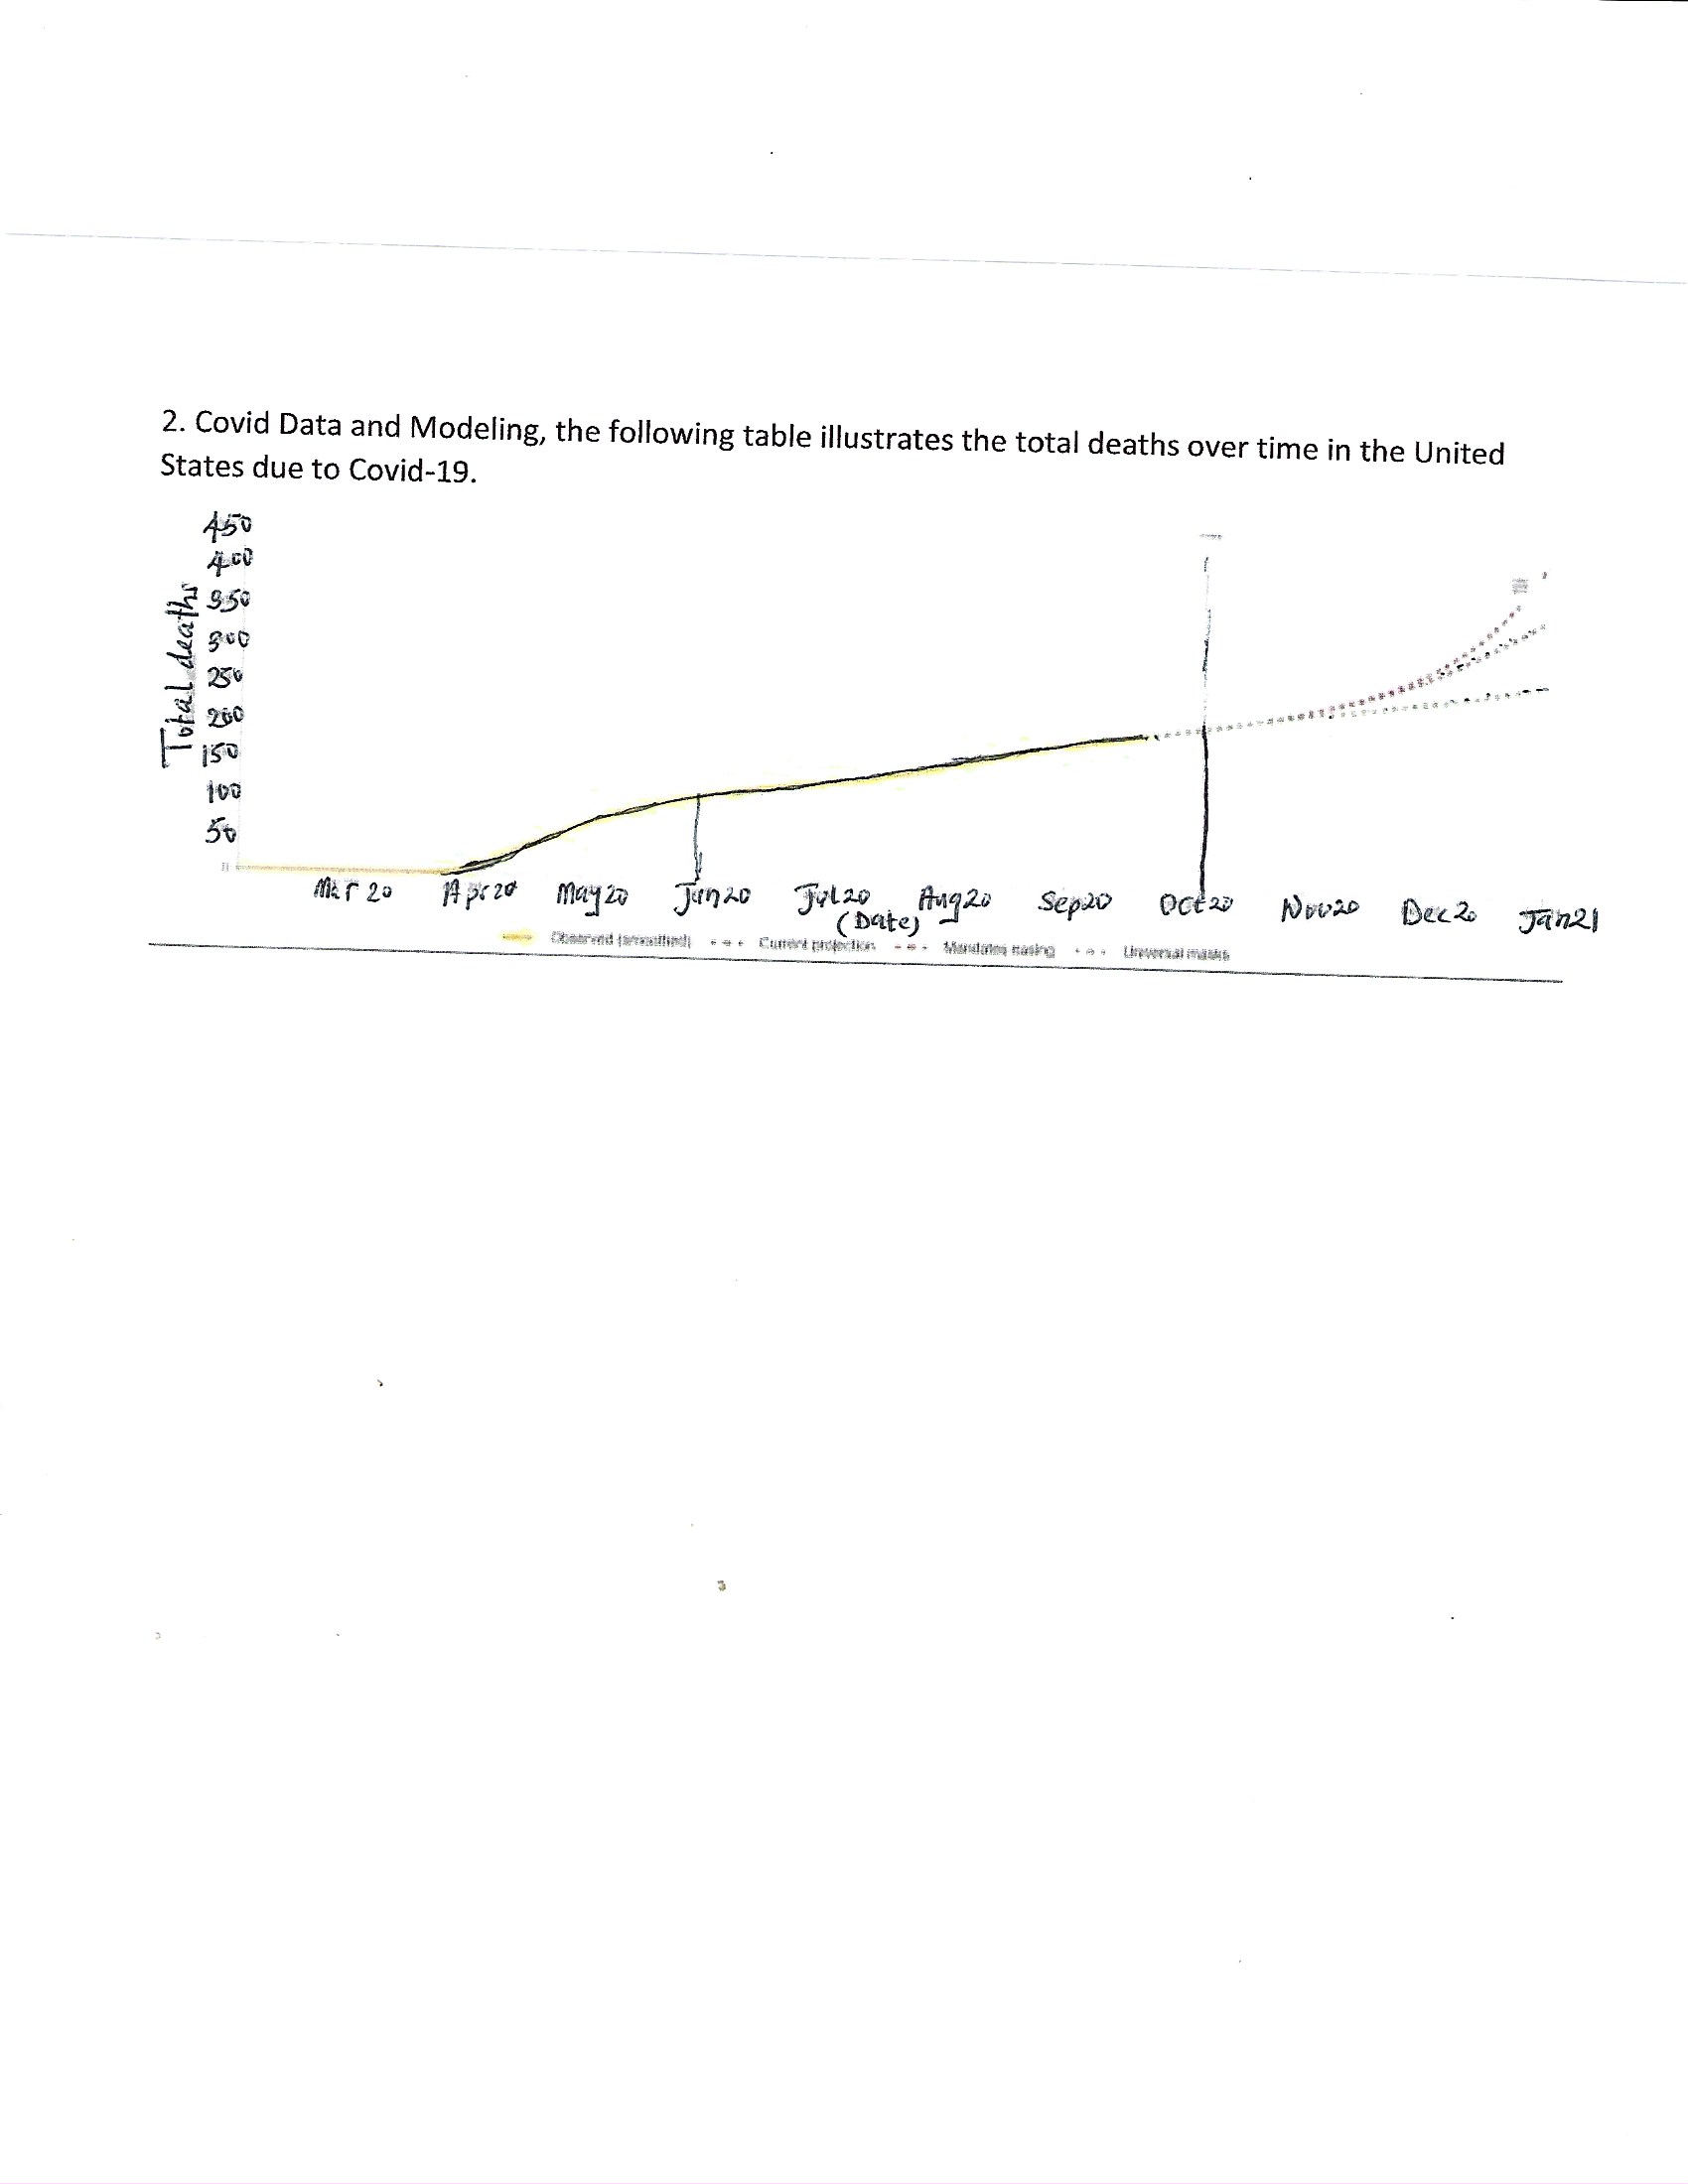
Questions from the graph attached:
If the rate of change for Covid-19 is constant between June and October, determine the following
a. Approximate the slope (rate of change) between June and October. (Note: Number the months as1 for January, 2 for February, etc) List the values you used to determine the slope along with units.
b. What does the slope tell you about total Covid deaths? Explain in detail.
c. Use the slope intercept form of an equation of a line to find an equation that models the data between the months of June - October 2020.
d. According to the model that you found does the y-intercept make sense within the context of the problem? ( 3pts)
e. If the linear trend continues over time, what is the expected number of deaths expected by February and June of next year 2021?
f. Why can't we use a linear model to determine the number of deaths past the month of October 2020? What other factors could affect the overall trend?
Step by Step Solution
There are 3 Steps involved in it
Step: 1

Get Instant Access to Expert-Tailored Solutions
See step-by-step solutions with expert insights and AI powered tools for academic success
Step: 2

Step: 3
Ace Your Homework with AI
Get the answers you need in no time with our AI-driven, step-by-step assistance
Get Started
Calculus Early Transcendentals
Authors: James Stewart
7th edition
538497904, 978-0538497909