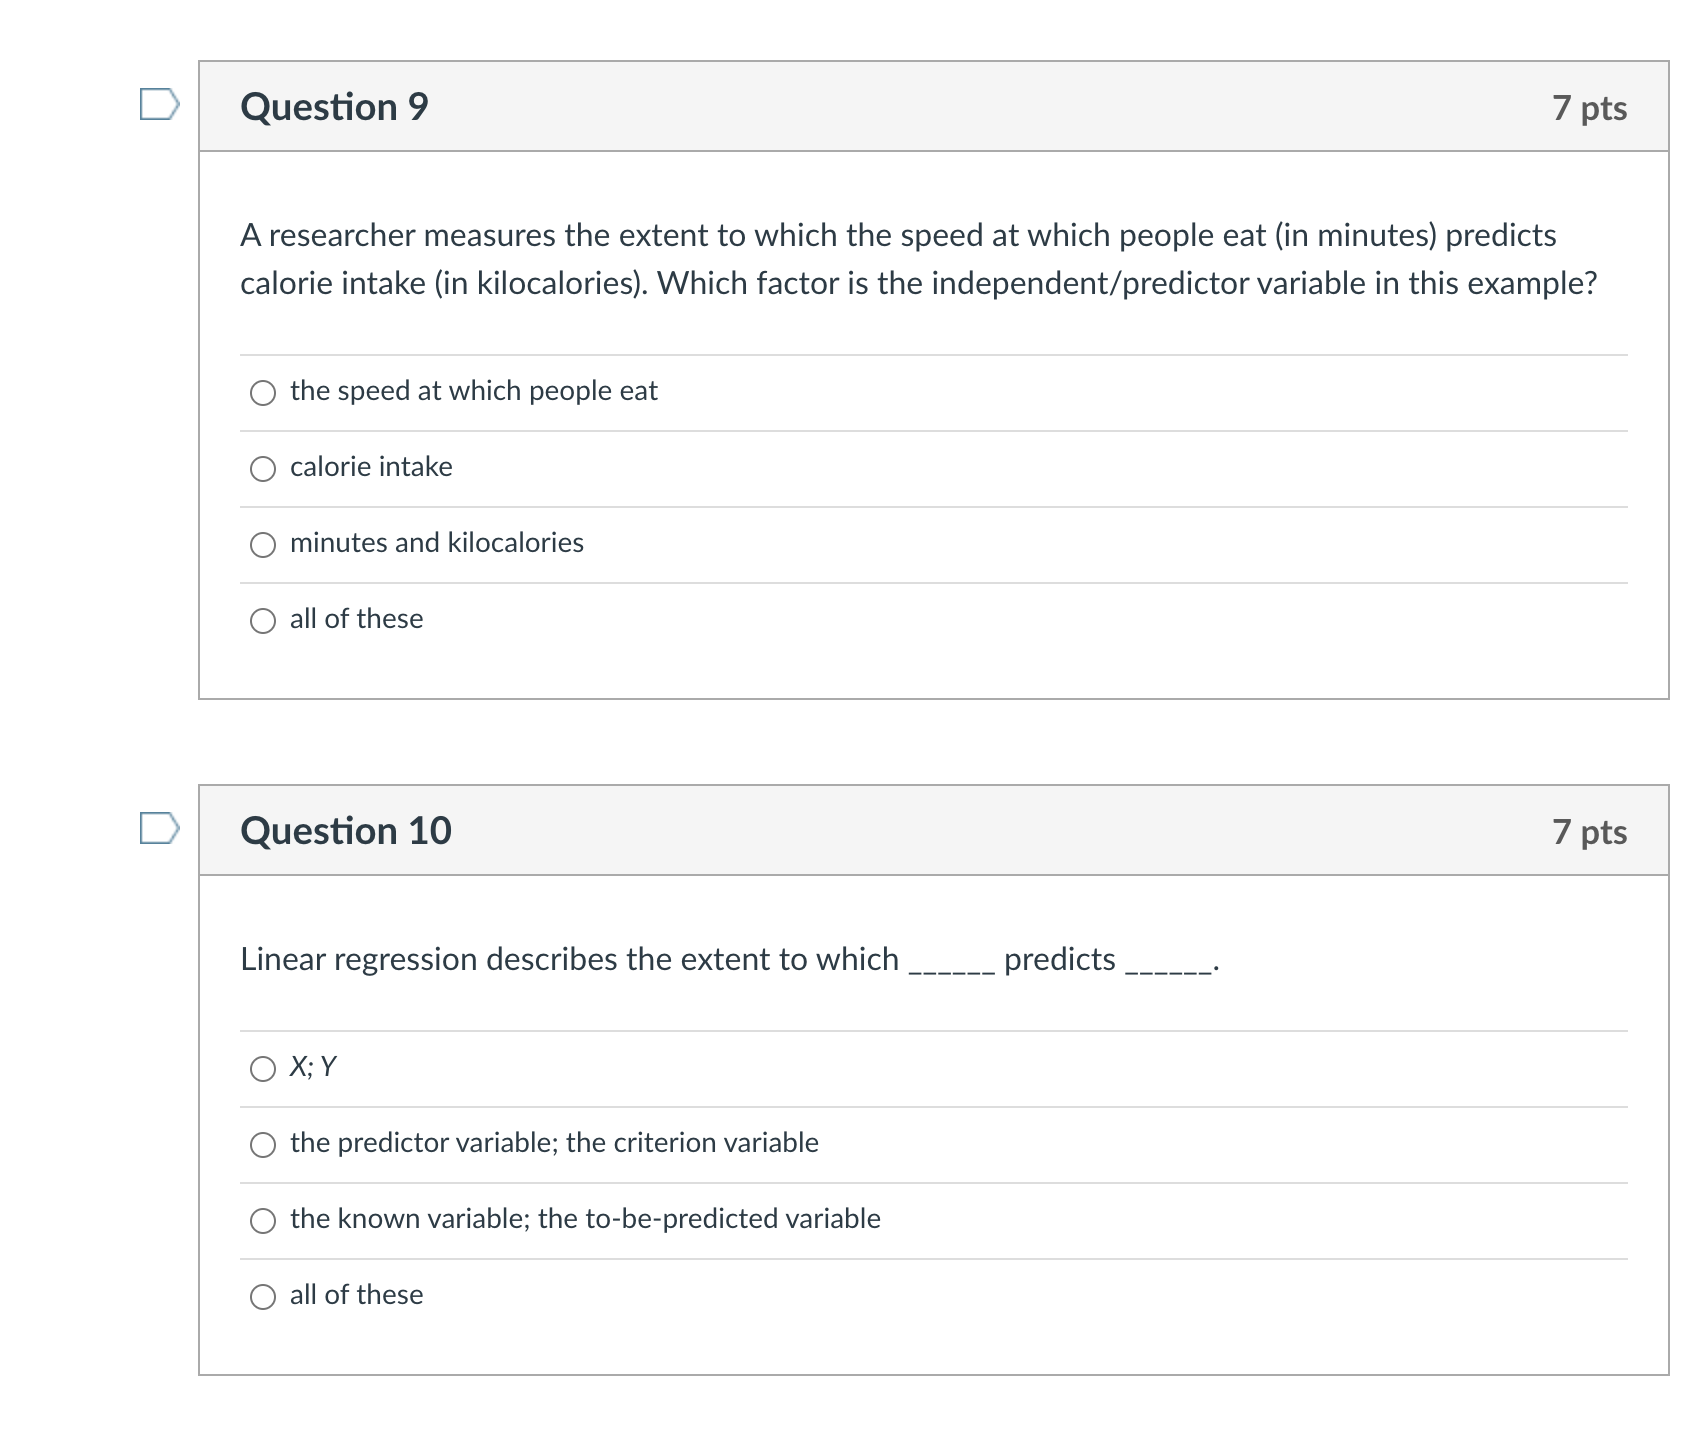
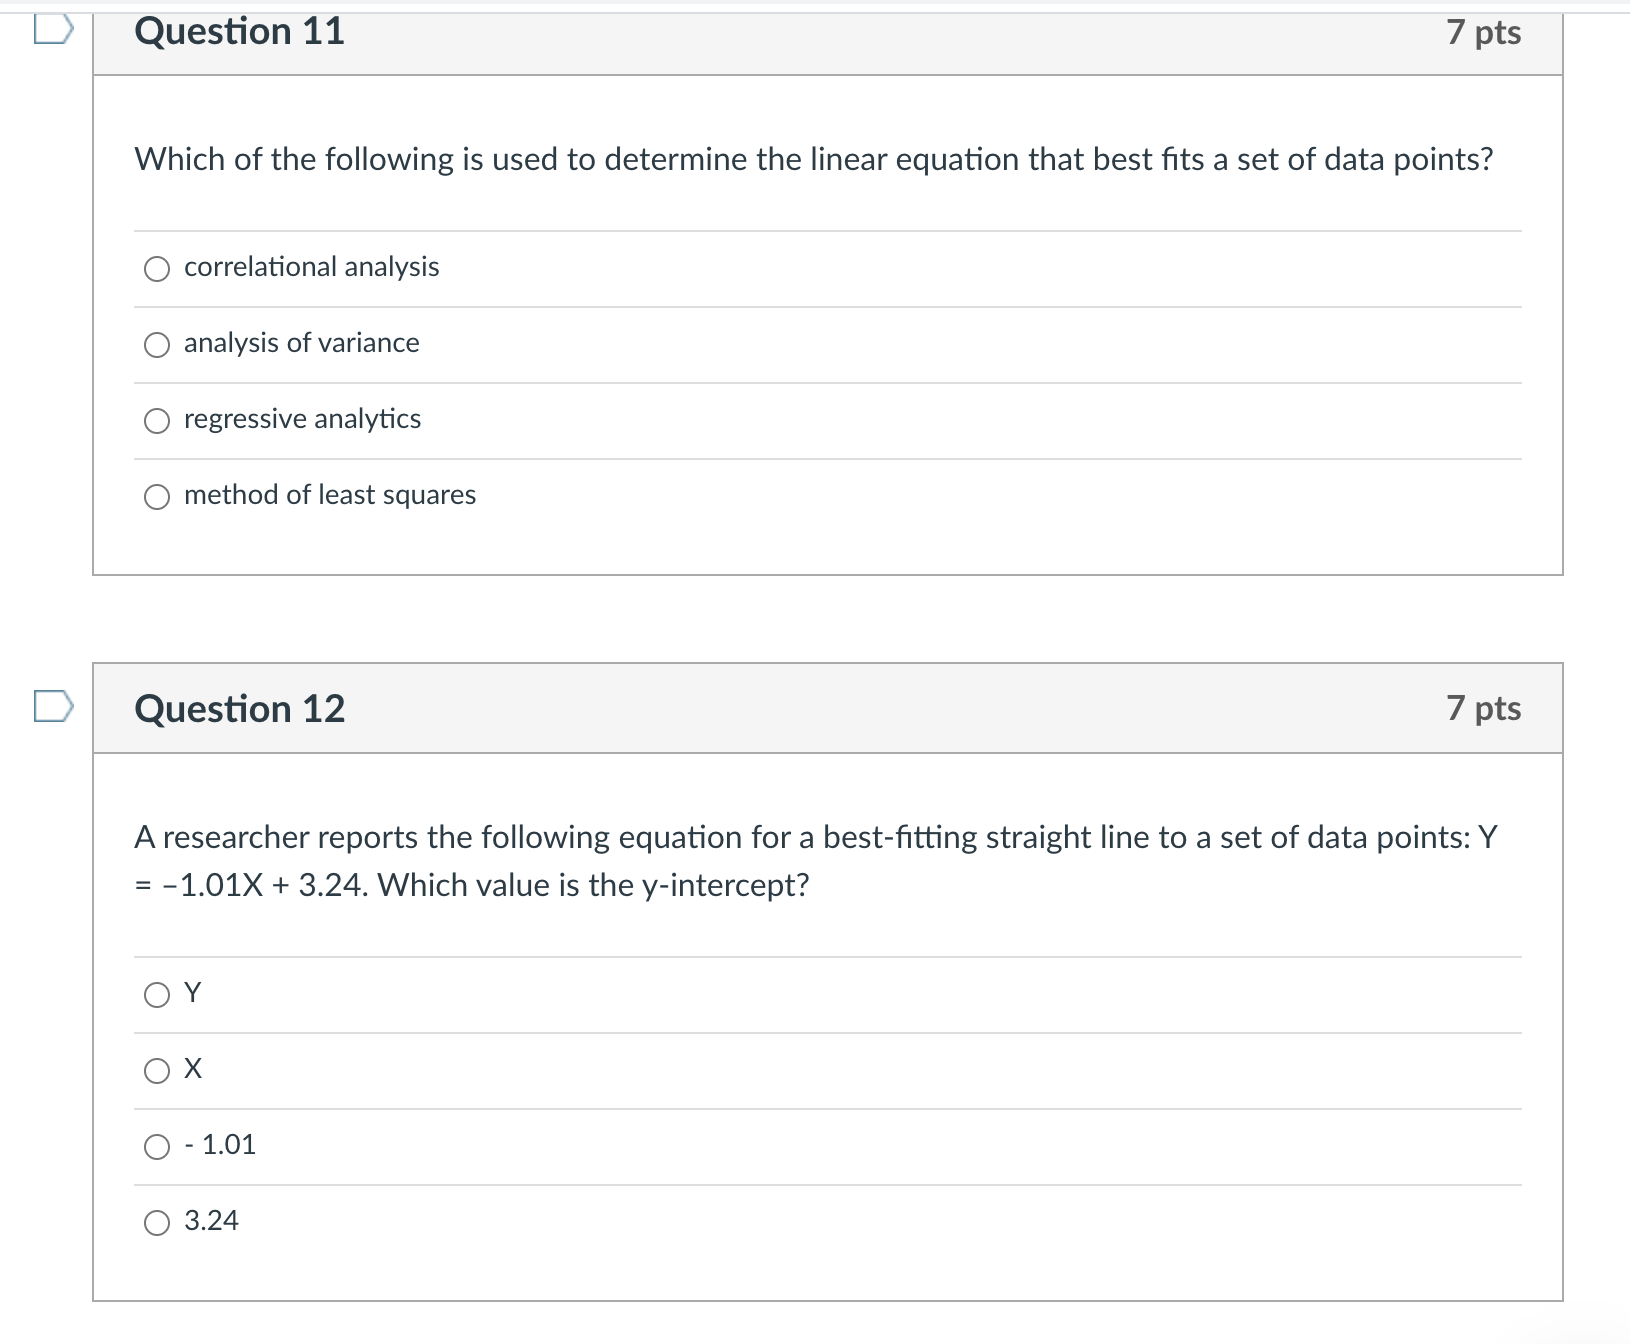
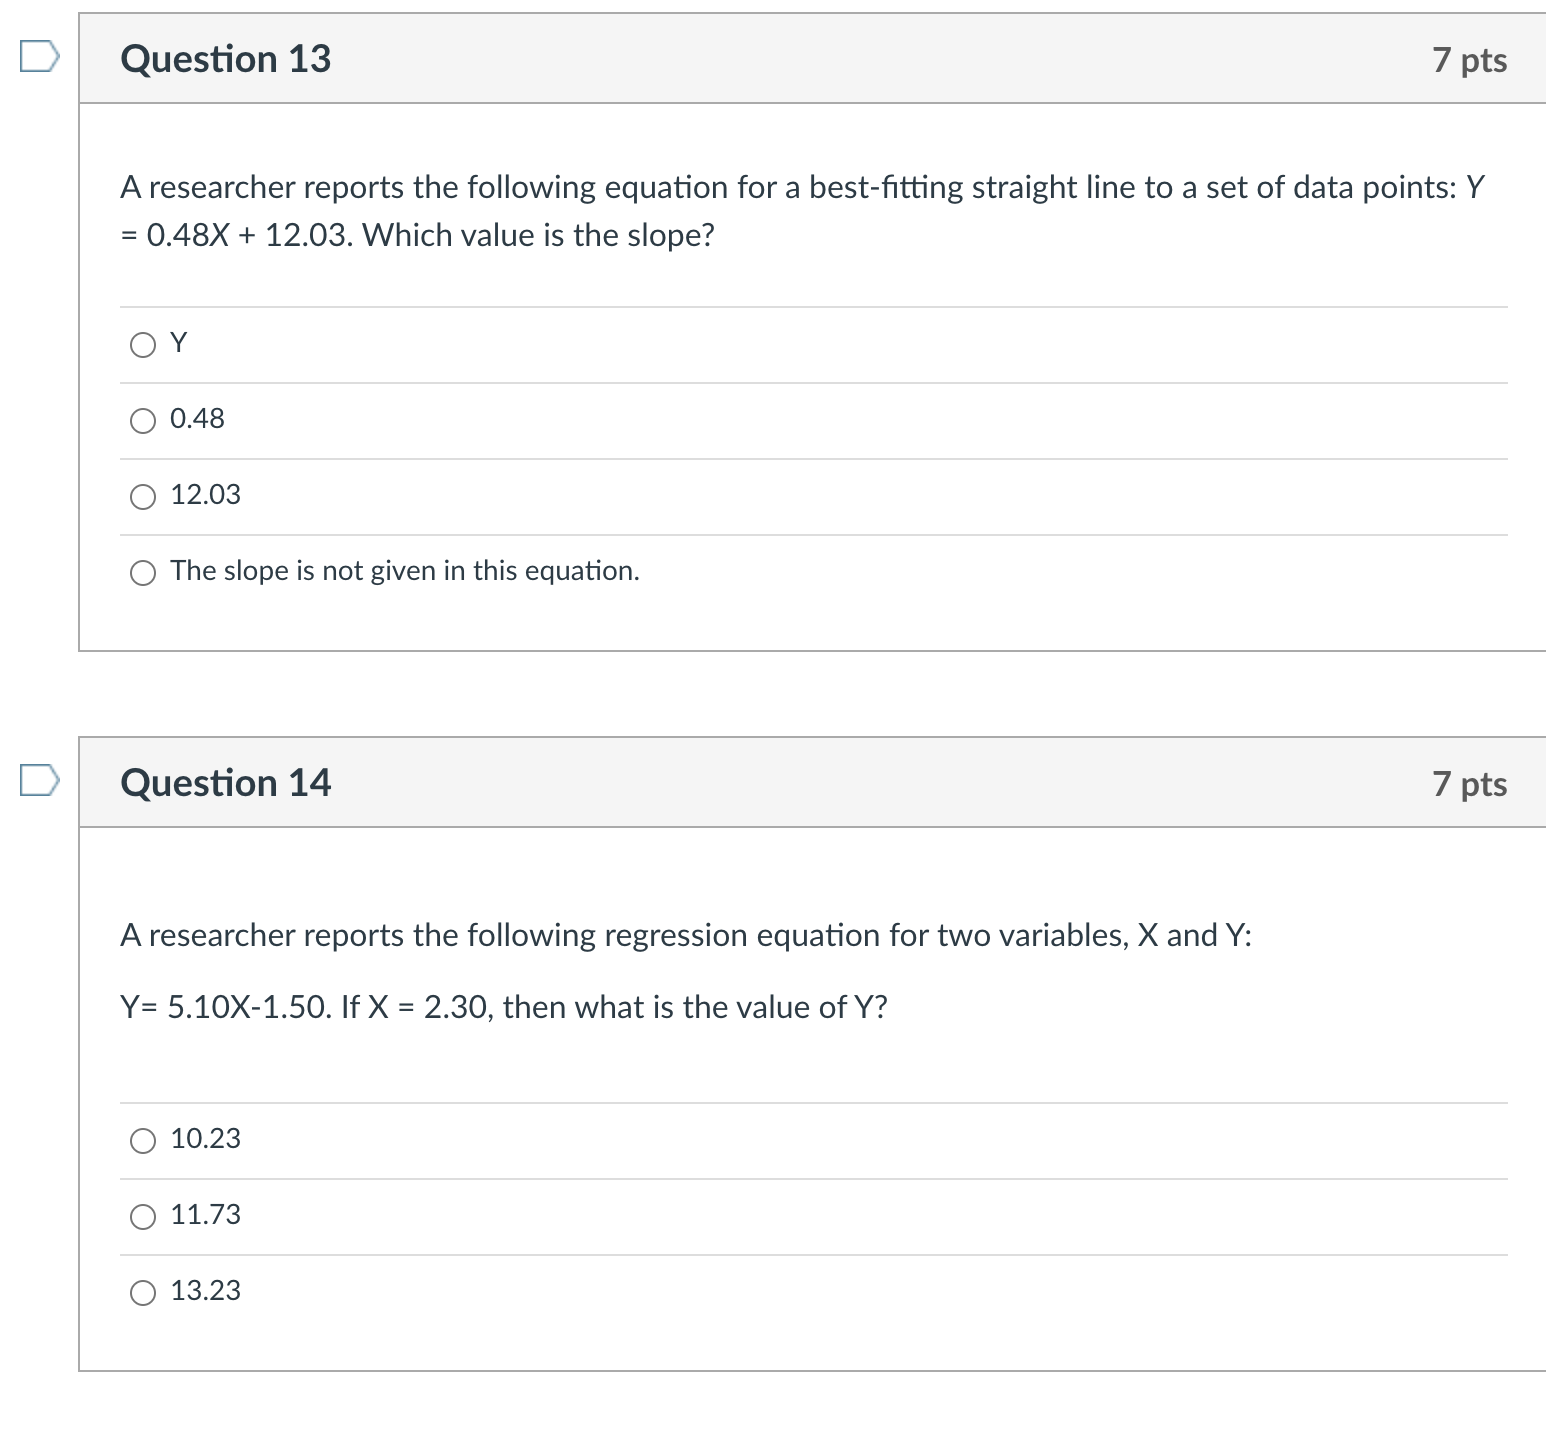
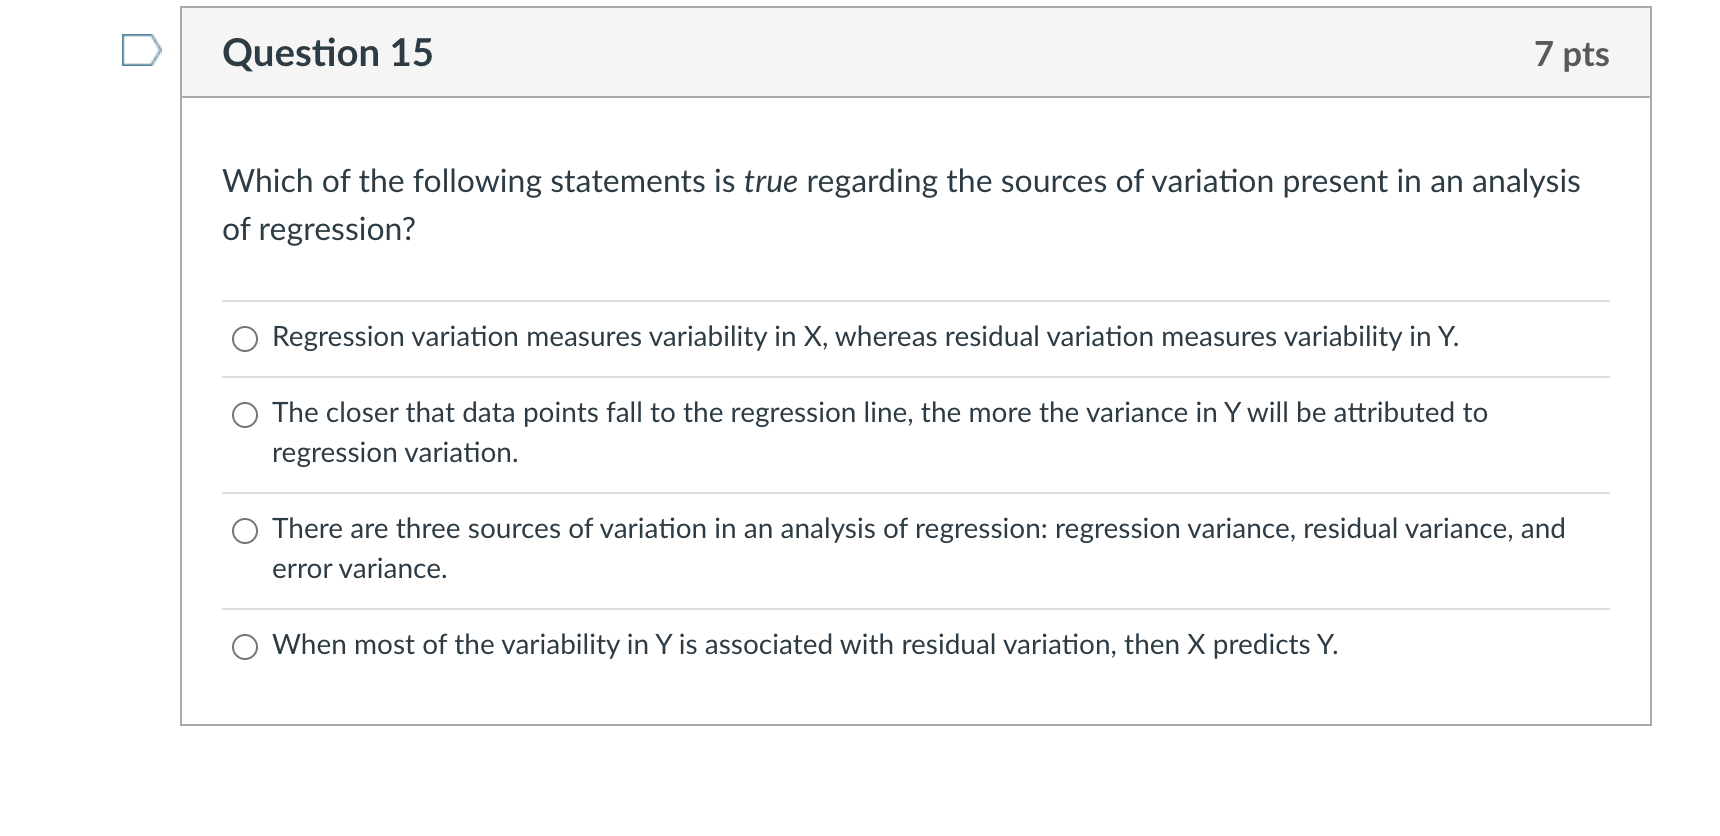
questions in attached pictures
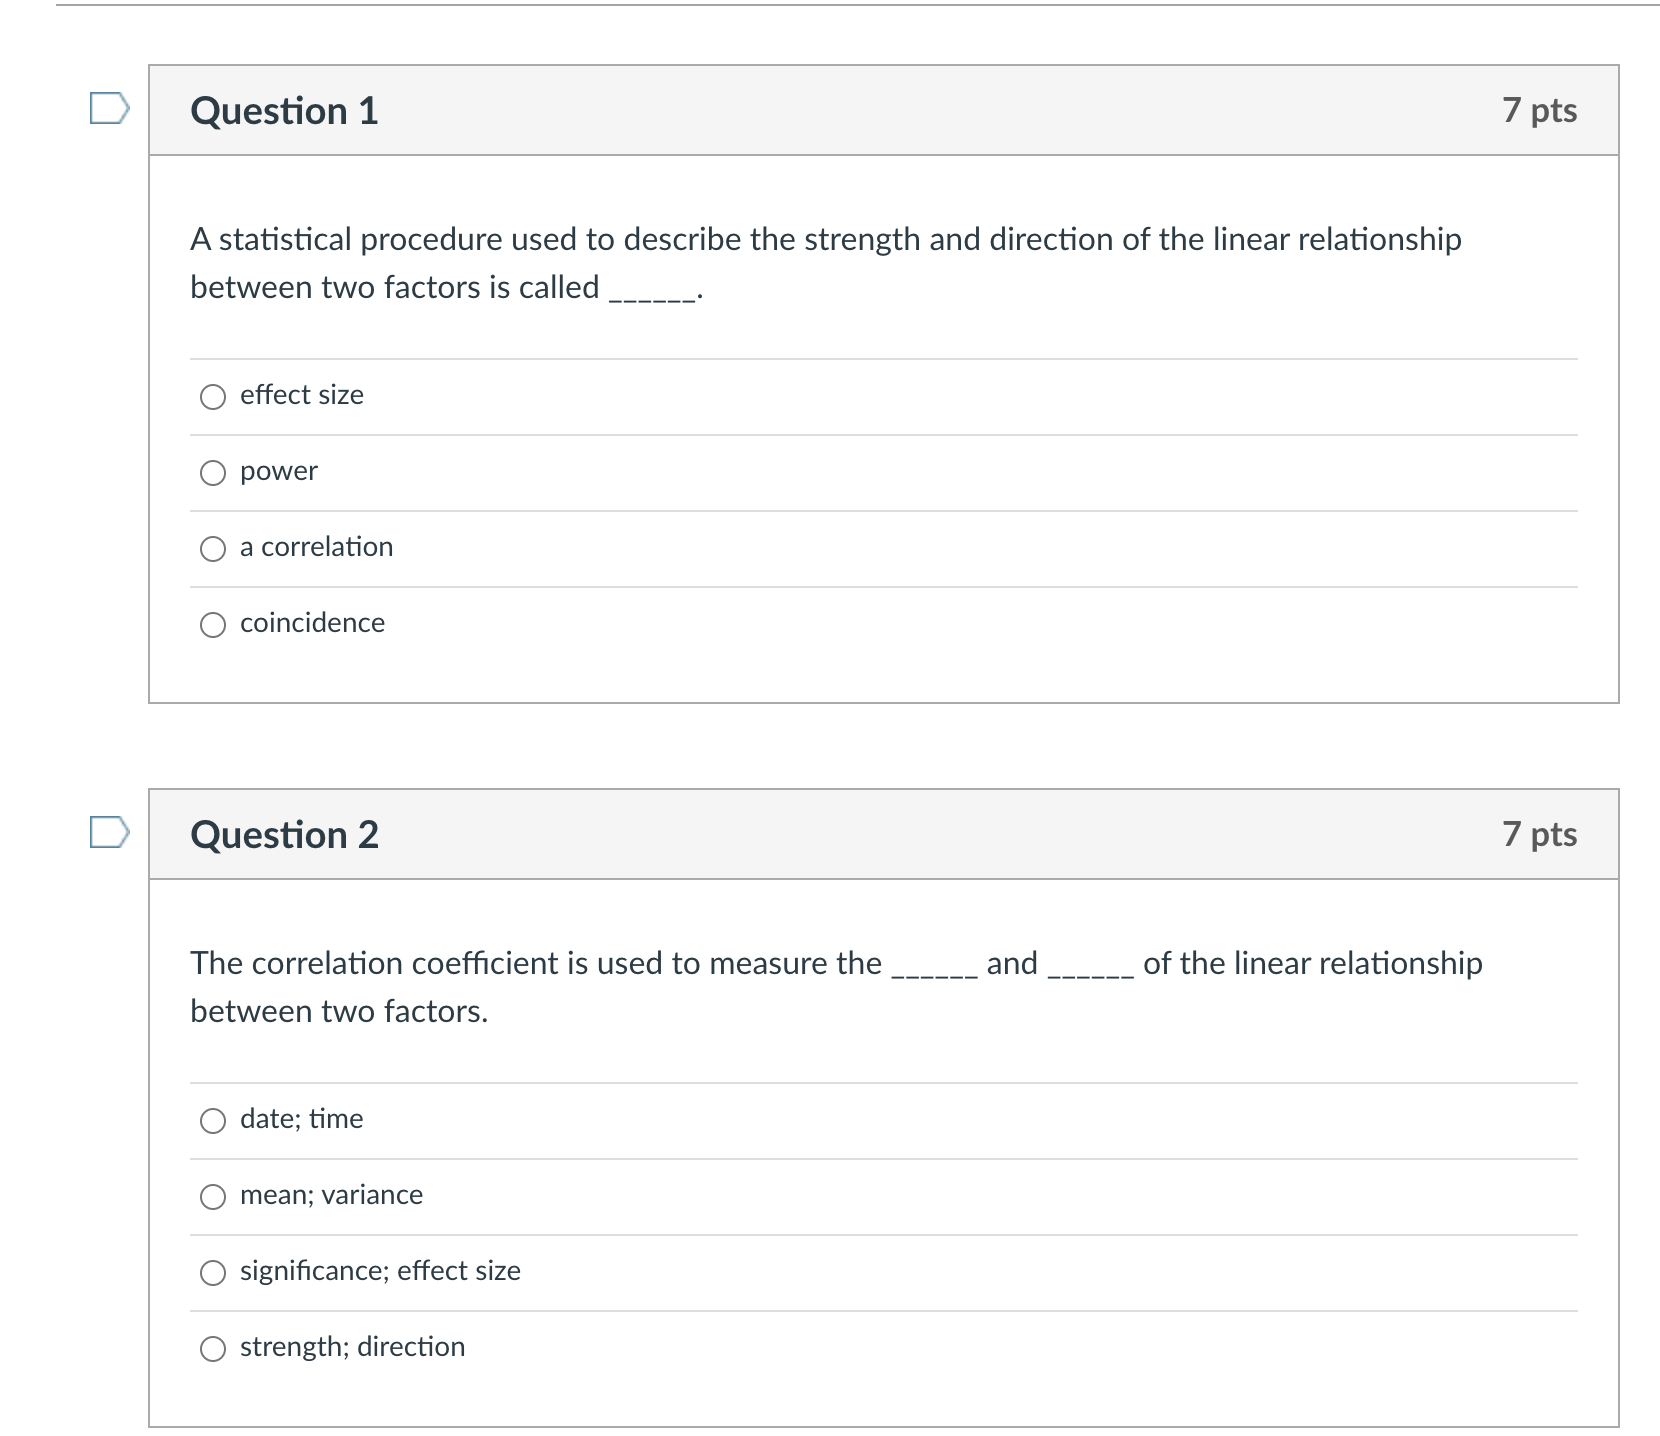
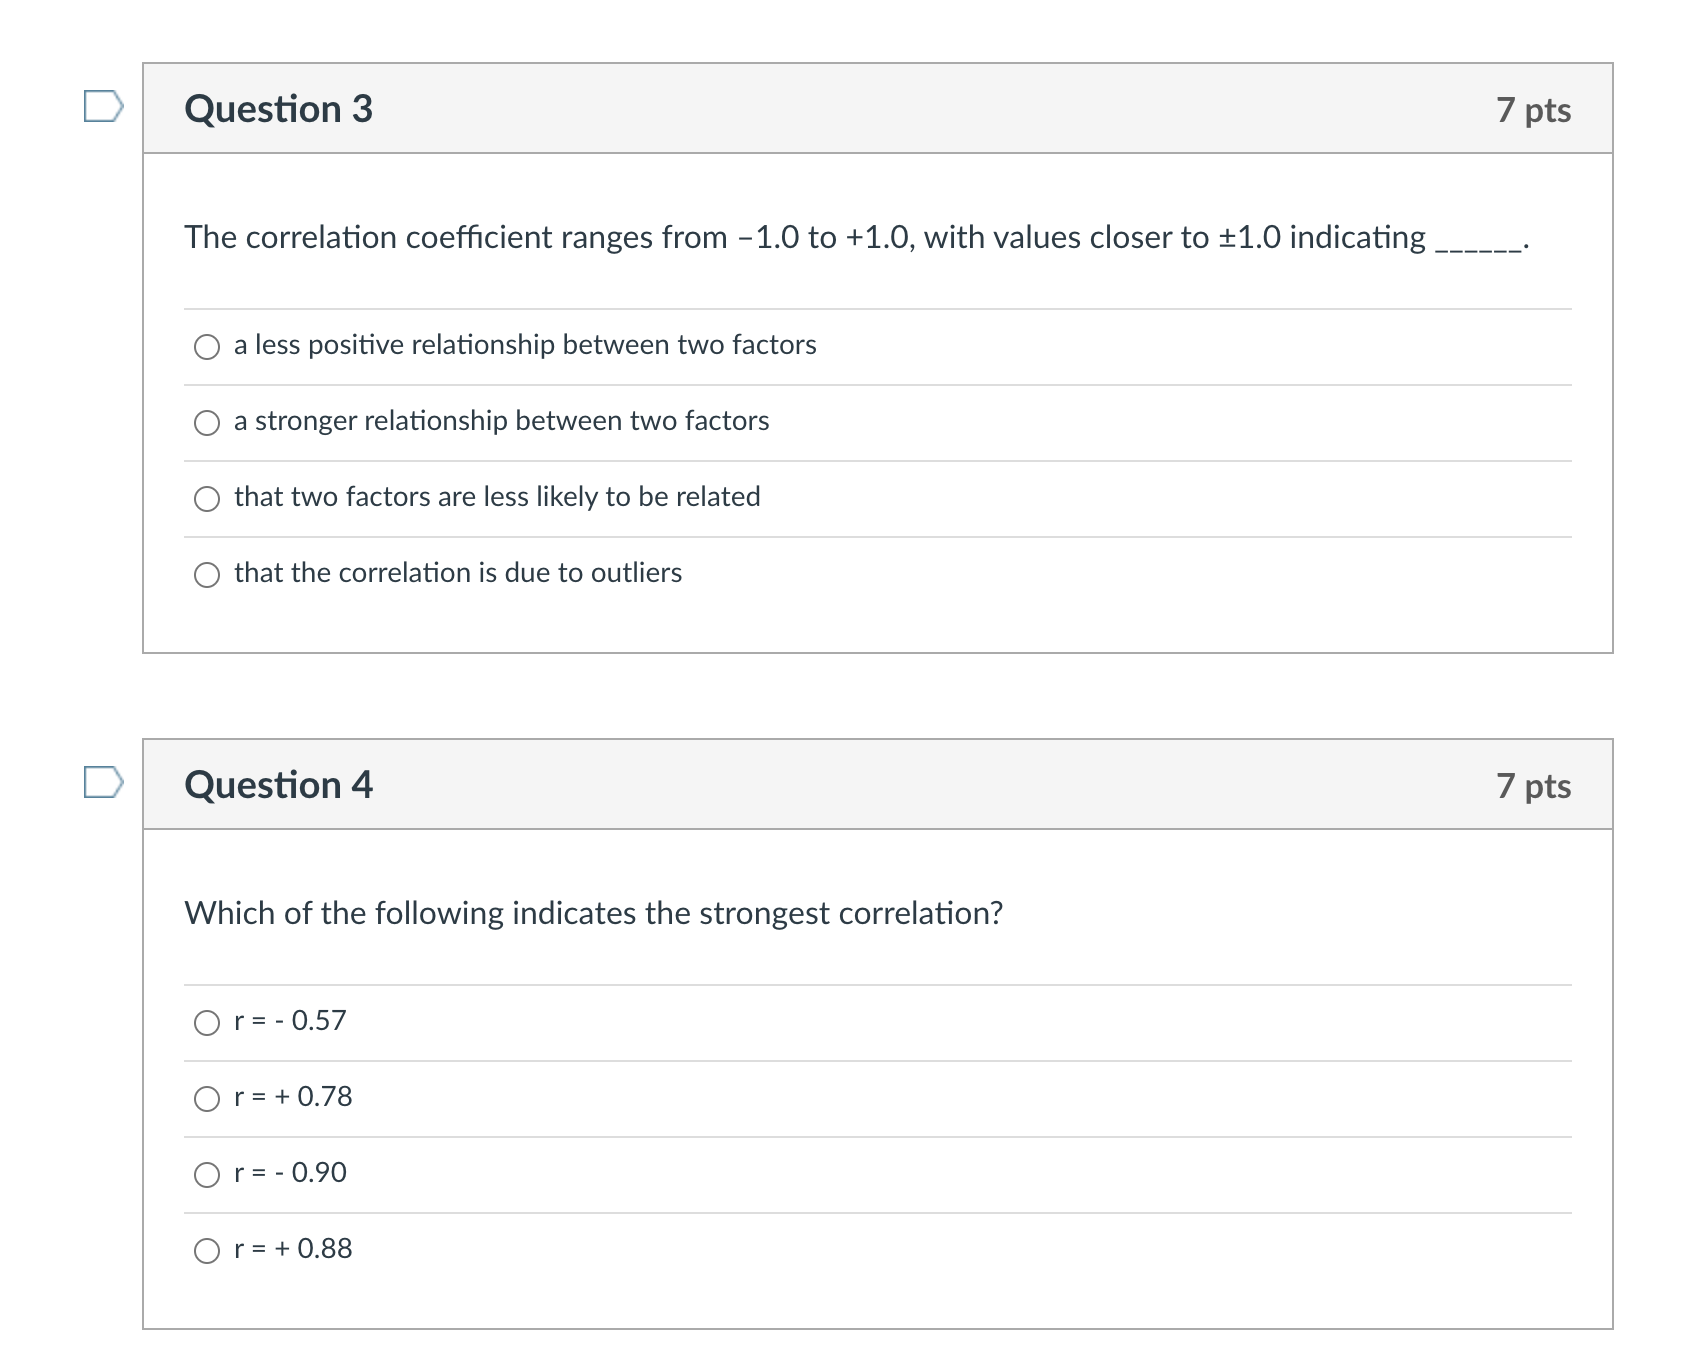
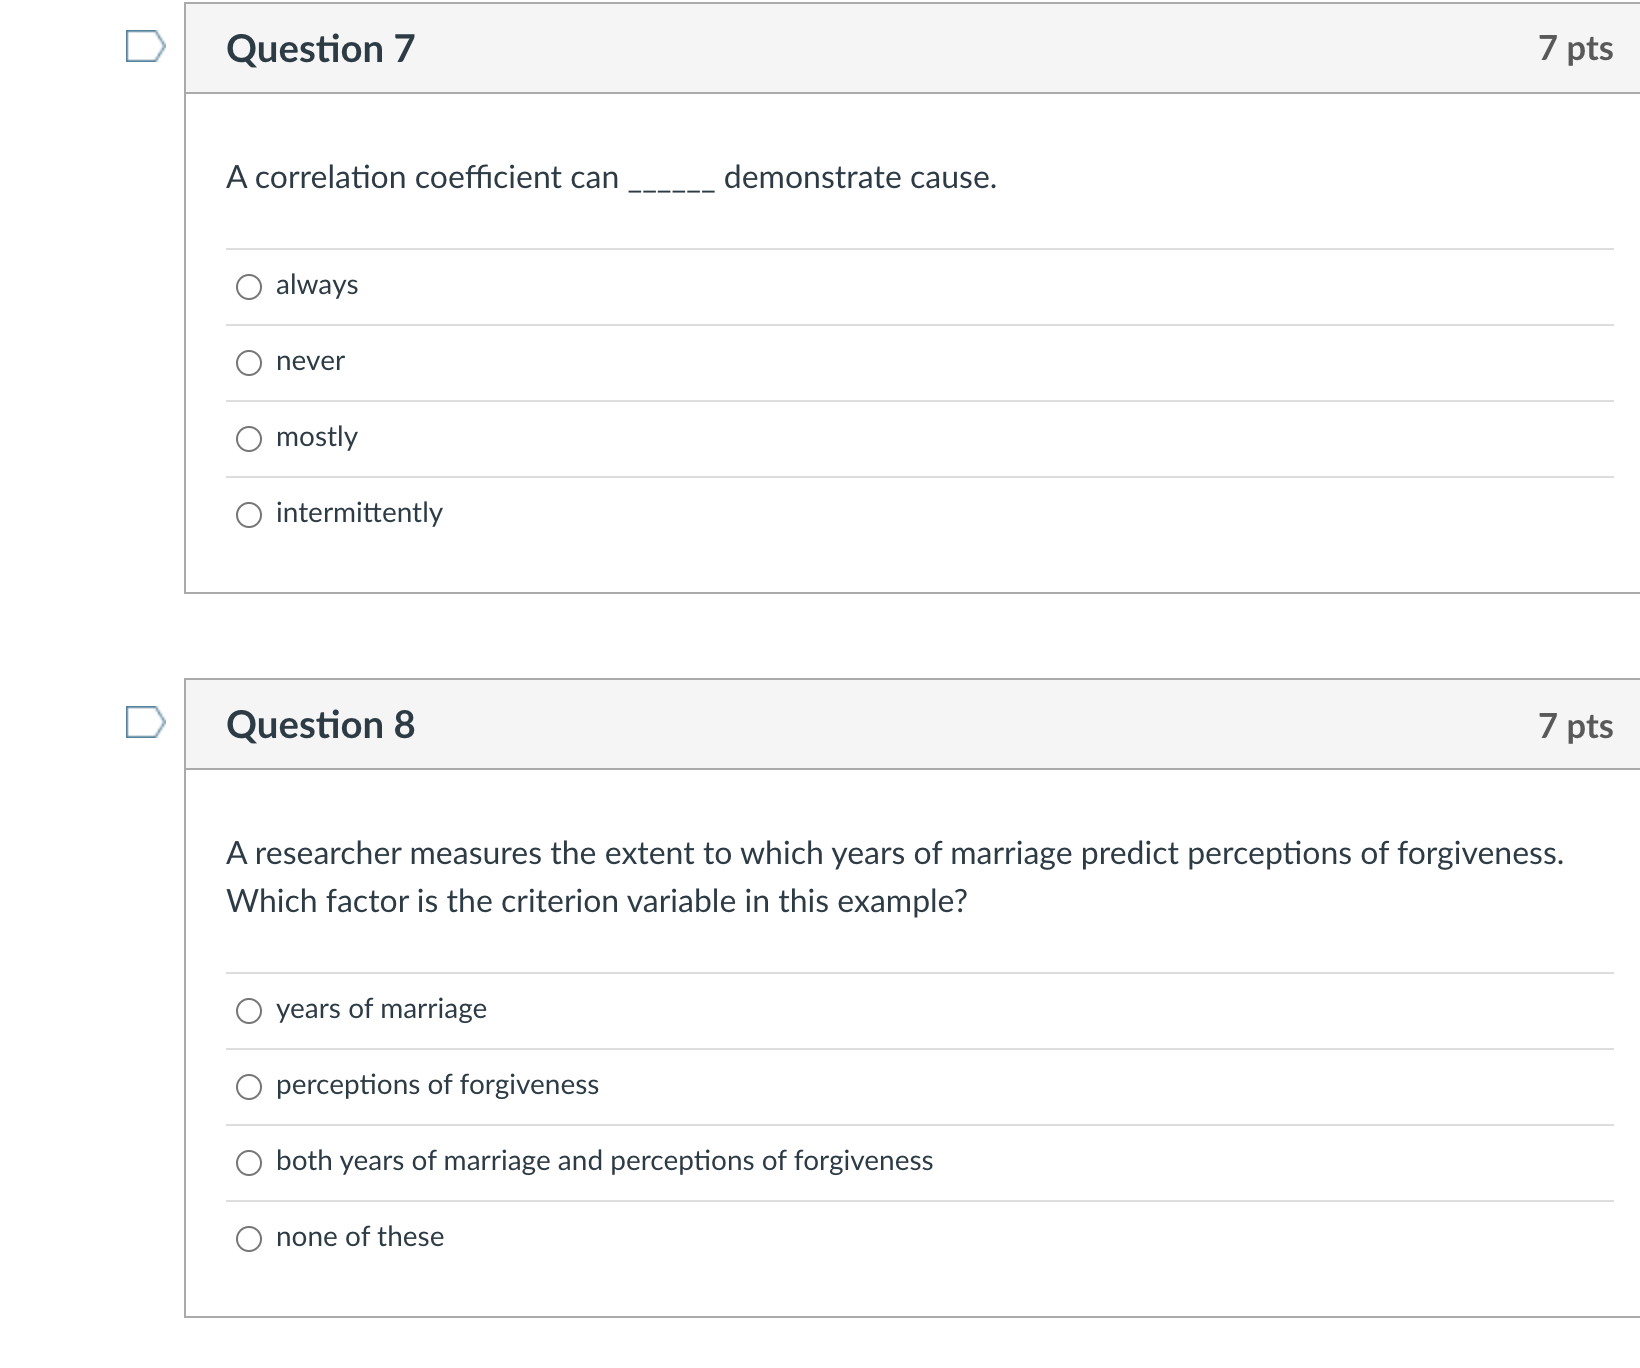
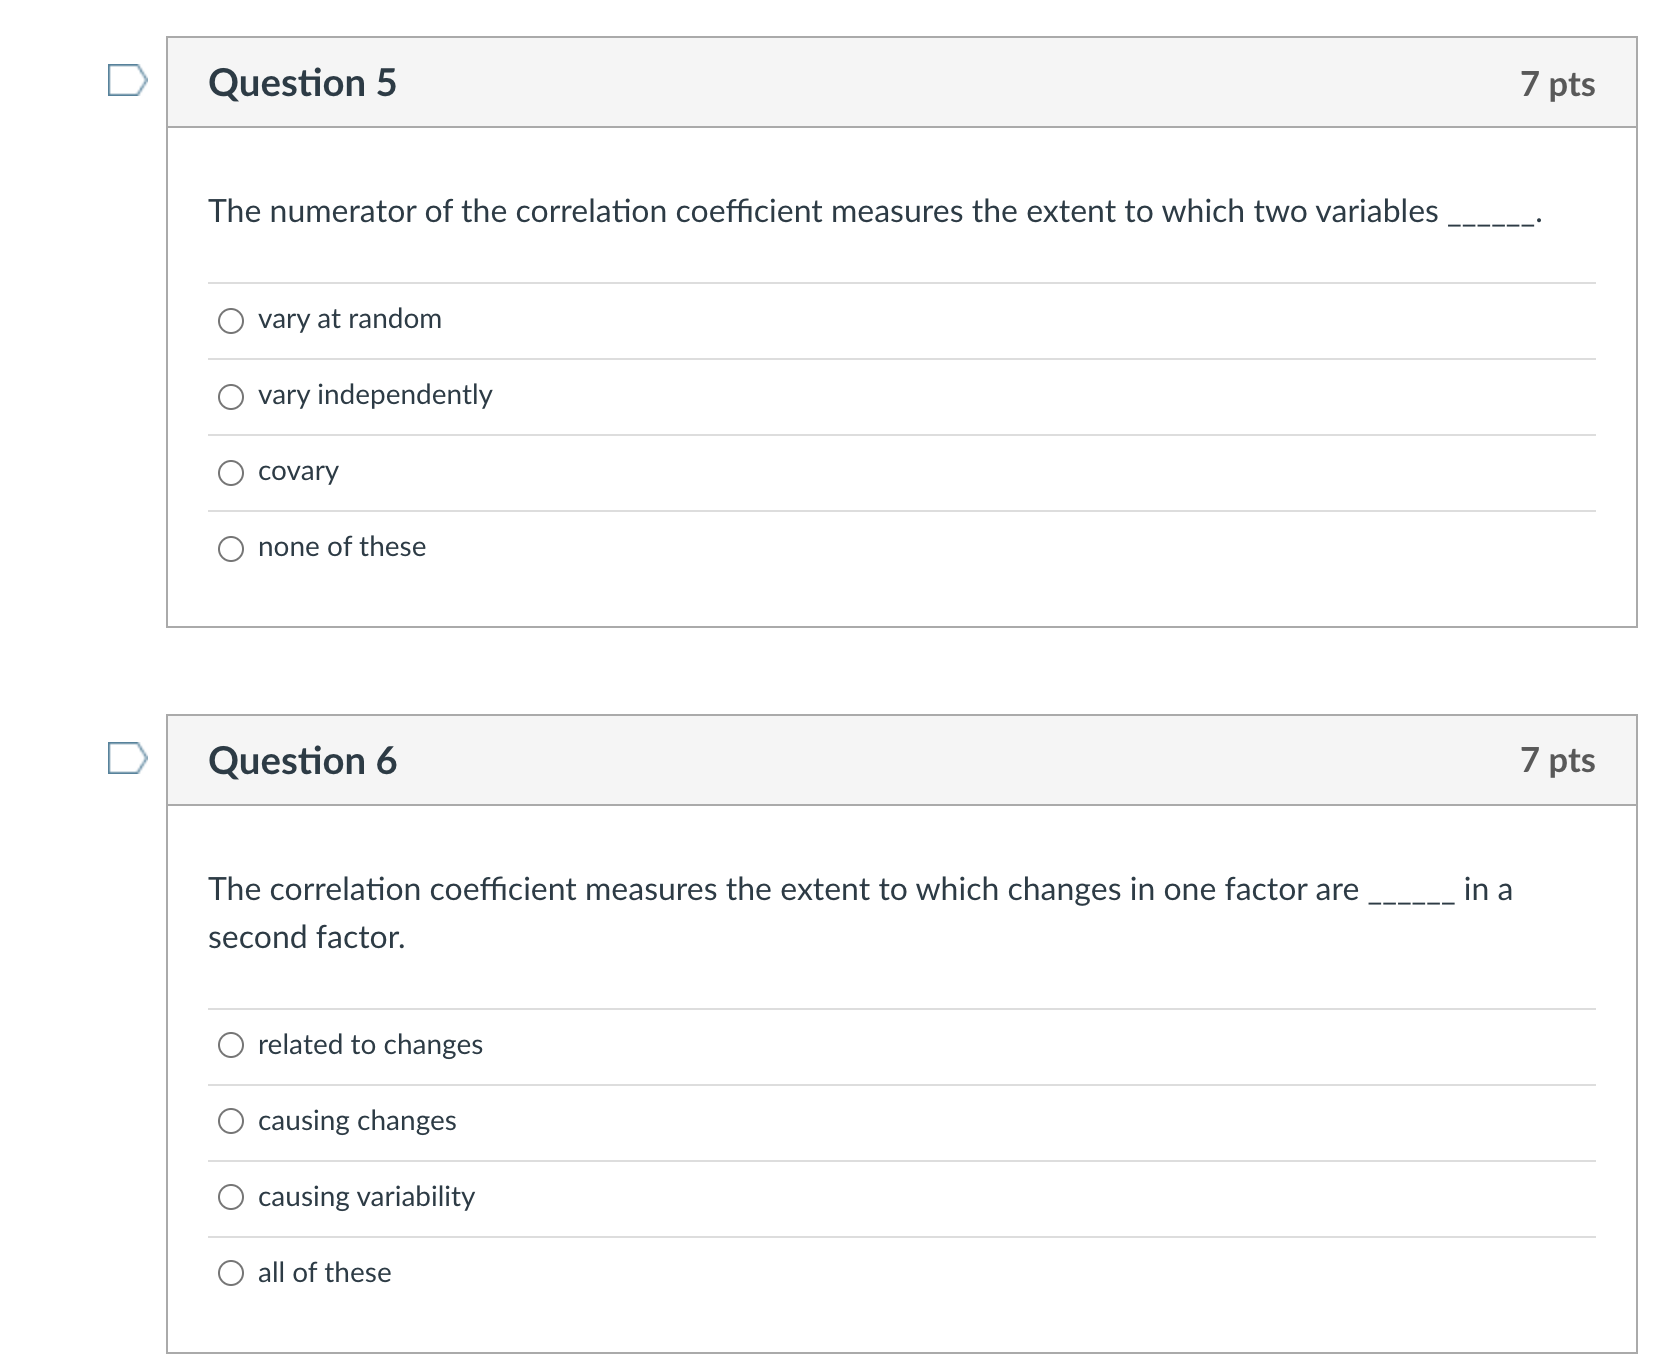
A statistical procedure used to describe the strength and direction of the linear relationship between two factors is called ______ 0 effect size 0 power 0 a correlation O coincidence D Question 2 The correlation coefcient is used to measure the ______ and ______ of the linear relationship between two factors. 0 date; time 0 mean; variance 0 significance; effect size 0 strength; direction _ The correlation coefcient ranges from 1.0 to +1.0, with values closer to $1.0 indicating ______ . O a less positive relationship between two factors 0 a stronger relationship between two factors 0 that two factors are less likely to be related 0 that the correlation is due to outliers D Question 4 7 pts Which of the following indicates the strongest correlation? Or=-0.57 o r=+0.78 Or=-0.90 O r=+0.88 D Question 7 7 pts A correlation coefficient can demonstrate cause. O always never O mostly O intermittently D Question 8 7 pts A researcher measures the extent to which years of marriage predict perceptions of forgiveness. Which factor is the criterion variable in this example? O years of marriage O perceptions of forgiveness O both years of marriage and perceptions of forgiveness O none of theseD Question 5 7 pts The numerator of the correlation coefficient measures the extent to which two variables O vary at random O vary independently O covary O none of these D Question 6 7 pts The correlation coefficient measures the extent to which changes in one factor are in a second factor. O related to changes O causing changes O causing variability O all of theseQuestion 9 7 pts A researcher measures the extent to which the speed at which people eat (in minutes) predicts calorie intake (in kilocalories). Which factor is the independent/predictor variable in this example? 0 the speed at which people eat 0 calorie intake 0 minutes and kilocalories 0 all of these Question 10 7 pts Linear regression describes the extent to which ______ predicts ______ . o X;Y O the predictor variable; the criterion variable 0 the known variable; the to-be-predicted variable 0 all of these D Question 11 7 pts Which of the following is used to determine the linear equation that best fits a set of data points? O correlational analysis O analysis of variance O regressive analytics O method of least squares D Question 12 7 pts A researcher reports the following equation for a best-fitting straight line to a set of data points: Y = -1.01X + 3.24. Which value is the y-intercept? OY OX O - 1.01 O 3.24D Question 13 7 pts A researcher reports the following equation for a best-tting straight line to a set of data points: Y = 0.48X + 12.03. Which value is the slope? O Y O 0.43 O 12.03 0 The slope is not given in this equation. Question 14 7 pts A researcher reports the following regression equation for two variables, X and Y: Y: 5.10X-1.50. If X = 2.30, then what is the value of Y? O 10.23 C) 11.73 0 13.23 Question 15 7 pts Which of the following statements is true regarding the sources of variation present in an analysis of regression? 0 Regression variation measures variability in X, whereas residual variation measures variability in Y. O The closer that data points fall to the regression line, the more the variance in Y will be attributed to regression variation. 0 There are three sources of variation in an analysis of regression: regression variance, residual variance, and error variance. 0 When most of the variability in Y is associated with residual variation, then X predicts Y
