

Question
----------- Questions ----------- Q1 Consider the following revenue and cost data for Shannons Brewery in Keller, Texas. Shannons sells 35% of its craft beer production
-----------
Questions
-----------
Q1
Consider the following revenue and cost data for Shannons Brewery in Keller, Texas. Shannons sells 35% of its craft beer production through its own on-premise taproom. The bulk of its sales (65%) are made off-premise via various retail outlets including supermarkets, bars, and restaurants. 40% of its of sales (on-premise and off-premise) consists of package sales (bottles and cans). Of this 40%, beer sold in cans accounts for 80% with sales of bottled beer accounting for the remaining 20%. Finally, the bulk of Shannons craft beer sales (60%) occurs in kegs (31 gallons per keg). Assume that overall sales for FY 2018 are expected to be $1143192. Given the proportions of beer sold in kegs, bottles, and cans, what will be the predicted dollar sales of beer sold in kegs? Round your answer to the nearest one dollar.
----
Q2
Assume the following costs in each of the categories identified in question one are:
| Packaged (Cans & Bottles) | $161881 |
| Kegs | $68517 |
| Shrinkage/WIP Loss | $42,000 |
| Contract Labor | $9,000 |
| Direct Labor | $240,000 |
| Freight | $18,000 |
| Consumer Advertising | $30,000 |
| Trade Promotion | $30,000 |
| Sales Promotion | $18,000 |
| Salaries & Benefits | $180,000 |
What is Shannon's cost of goods sold?
----
Q3
Assume that projected revenue for 2018 is 1067410. Also assume the following projected 2018 costs in each of the cost categories from question one:
| Packaged (Cans & Bottles) | $138009 |
|
| Kegs | $76497 |
|
| Shrinkage/WIP Loss | $42,000 | |
| Contract Labor | $9,000 | |
| Direct Labor | $240,000 | |
| Freight | $18,000 | |
| Consumer Advertising | $30,000 | |
| Trade Promotion | $30,000 | |
| Sales Promotion | $18,000 | |
| Salaries & Benefits | $180,000 |
Given these costs, compute Shannons projected contribution margin in dollars.
--------
Q.4
Assume that total sales revenue for 2018 is projected to be $1335503. Assume also the following costs for Shannons Brewery:
| Packaged (Cans & Bottles) | $150,000 |
|
| Kegs | $80,000 |
|
| Shrinkage/WIP Loss | $42,000 | |
| Contract Labor | $9,000 | |
| Direct Labor | $240,000 | |
| Freight | $18,000 | |
| Consumer Advertising | $30703 | |
| Trade Promotion | $34690 | |
| Sales Promotion | $18,000 | |
| Salaries & Benefits | $180,000 |
Compute Shannons %NMC. Round your answer to the nearest percent. For example, if your computed answer is 99.4% your answer rounds down to 99%. If your computed answer is 99.5% you should round up to 100%. DO NOT INCLUDE THE % SIGN IN YOUR ANSWER.
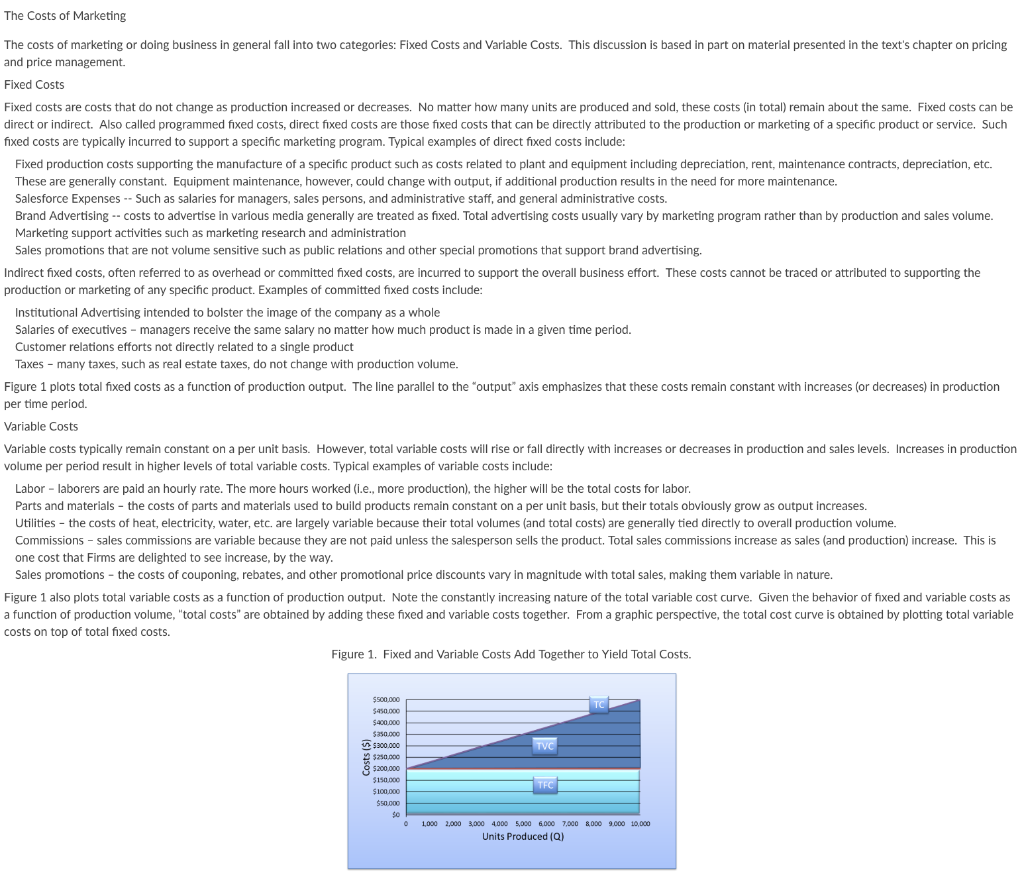
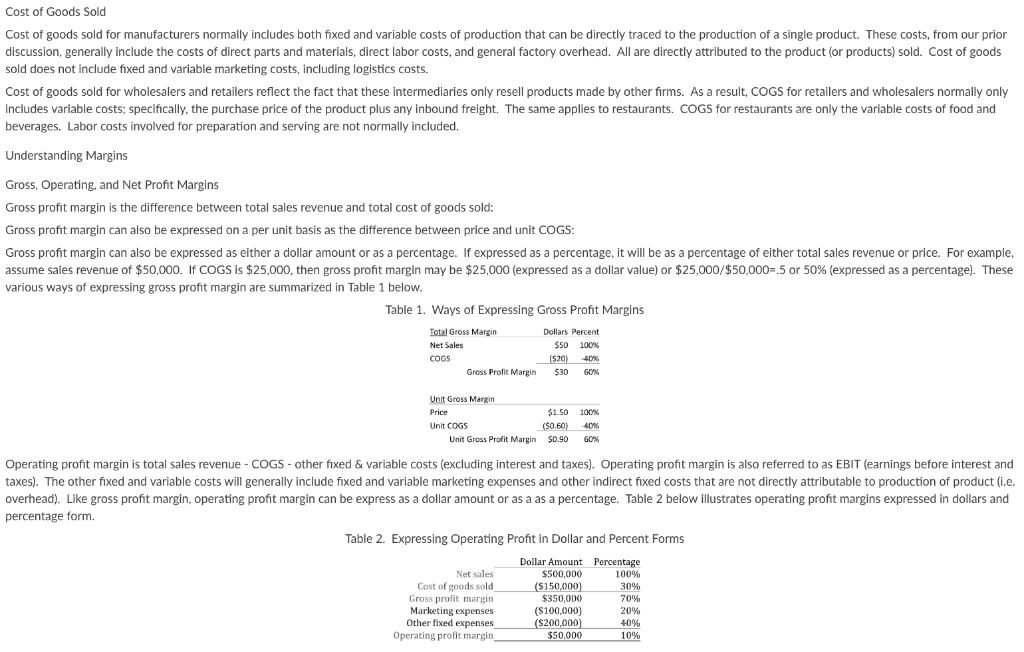
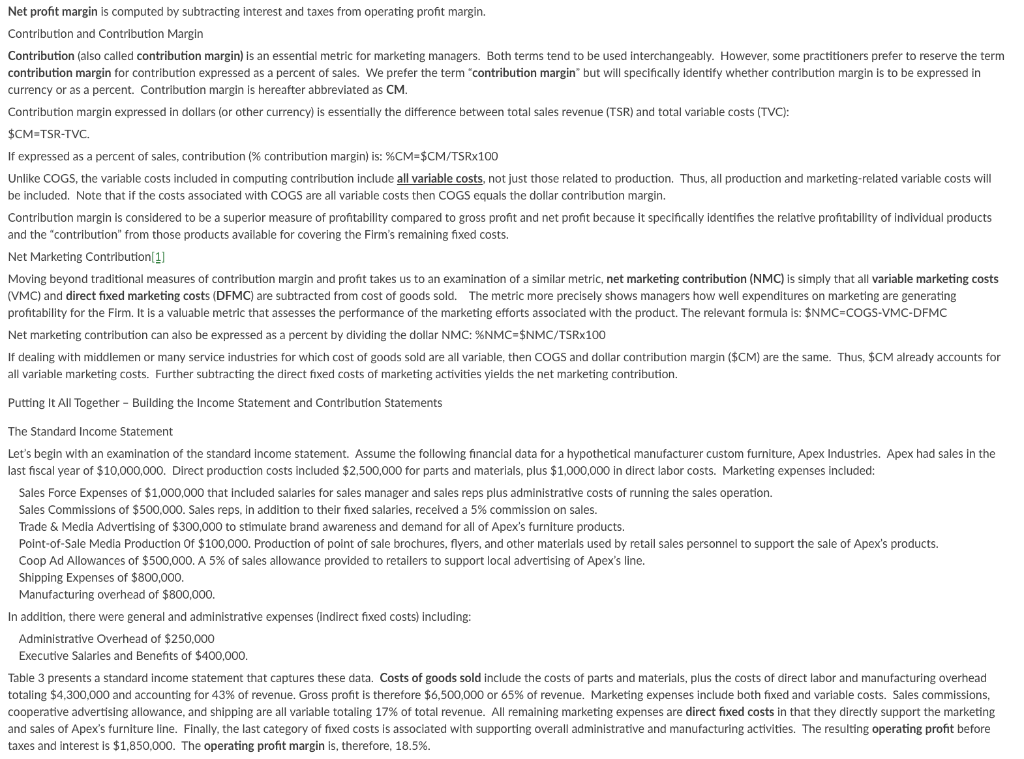
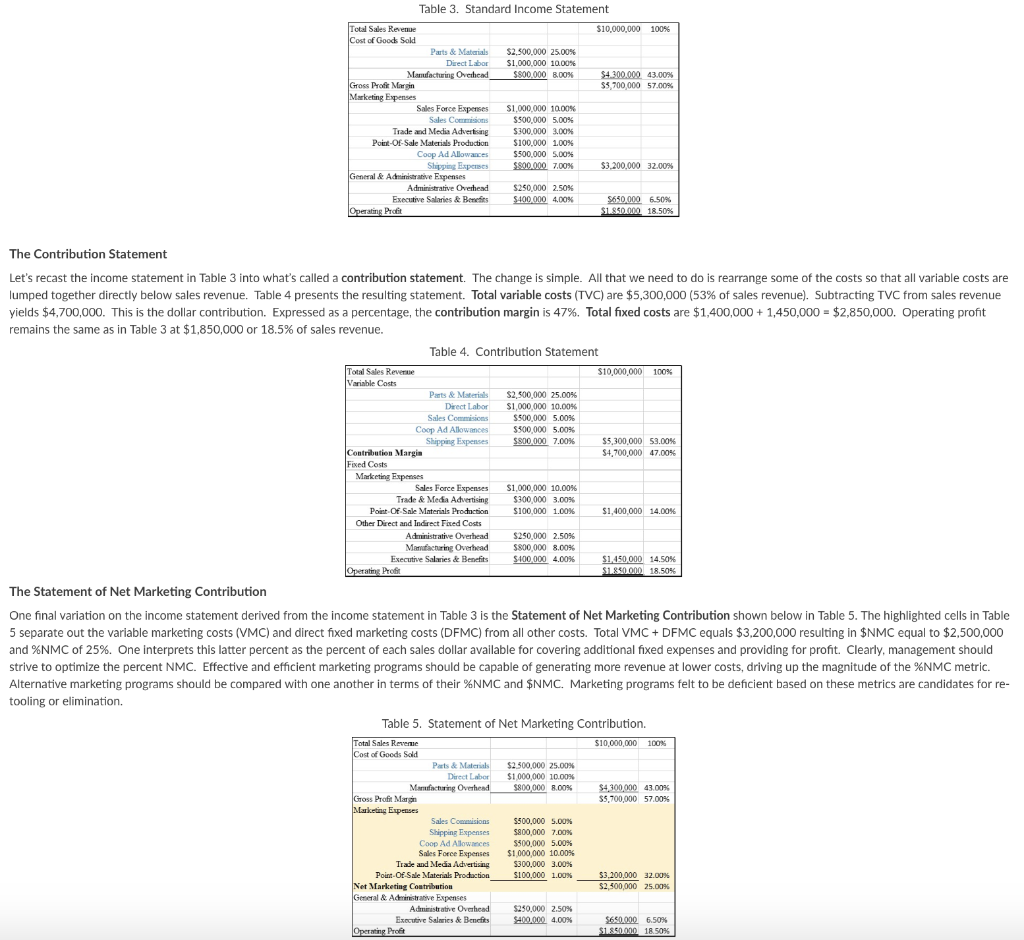
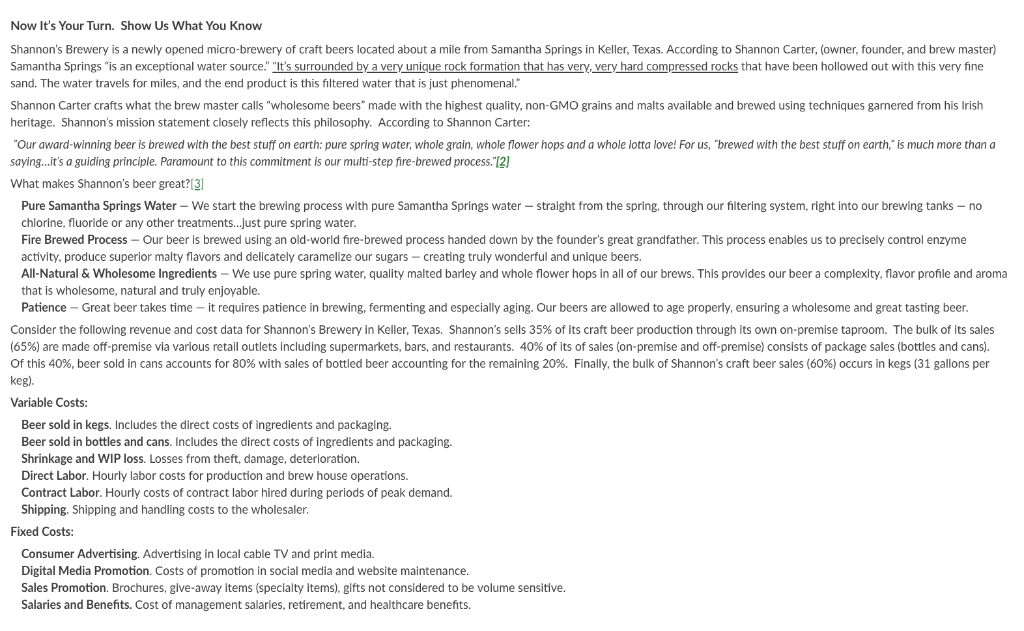
The Costs of Marketing The costs of marketing or doing business in general fall into two categories: Fixed Costs and Variable Costs. This discussion is based in part on material presented in the text's chapter on pricing and price management. Fixed Costs Fixed costs are costs that do not change as production increased or decreases. No matter how many units are produced and sold, these costs (in total) remain about the same. Fixed costs can be direct or indirect. Also called programmed fixed costs, direct fixed costs are those fixed costs that can be directly attributed to the production or marketing of a specific product or service. Such fixed costs are typically incurred to support a specific marketing program. Typical examples of direct fixed costs include: Fixed production costs supporting the manufacture of a specific product such as costs related to plant and equipment including depreciation, rent, maintenance contracts, depreciation, etc. These are generally constant. Equipment maintenance, however, could change with output, if additional production results in the need for more maintenance. Salesforce ExpensesSuch as salaries for managers, sales persons, and administrative staff, and general administrative costs. Brand Advertisingcosts to advertise in various media generally are treated as fixed. Total advertising costs usually vary by marketing program rather than by production and sales volume. Marketing support activities such as marketing research and administration Sales promotions that are not volume sensitive such as public relations and other special promotions that support brand advertising. Indirect fixed costs, often referred to as overhead or committed fixed costs, are incurred to support the overall business effort. These costs cannot be traced or attributed to supporting the production or marketing of any specific product. Examples of committed fixed costs include Institutional Advertising intended to bolster the image of the company as a whole Salaries of executives managers receive the same salary no matter how much product is made in a given time period. Customer relations efforts not directly related to a single product Taxes many taxes, such as real estate taxes, do not change with production volume. Figure 1 plots total fixed costs as a function of production output. The line parallel to the output" axis emphasizes that these costs remain constant with increases (or decreases) in production per time period. Variable Costs Variable costs typically remain constant on a per unit basis. However, total variable costs will rise or fall directly with increases or decreases in production and sales levels. Increases in production volume per period result in higher levels of total variable costs. Typical examples of variable costs include Labor laborers are paid an hourly rate. The more hours worked (i.e., more production), the higher will be the total costs for labor Parts and materials the costs of parts and materials used to build products remain constant on a per unit basis, but their totals obviously grow as output increases. Utilities the costs of heat, electricity, water, etc. are largely variable because their total volumes (and total costs) are generally tied directly to overall production volume. Commissions sales commissions are variable because they are not paid unless the salesperson sells the product. Total sales commissions increase as sales (and production) increase. This is one cost that Firms are delighted to see increase, by the way Sales promotions the costs of couponing, rebates, and other promotional price discounts vary in magnitude with total sales, making them variable in nature. Figure 1 also plots total variable costs as a function of production output. Note the constantly increasing nature of the total variable cost curve. Given the behavior of fixed and variable costs as a function of production volume, "total costs" are obtained by adding these fixed and variable costs together. From a graphic perspective, the total cost curve is obtained by plotting total variable costs on top of total fixed costs. Figure 1. Fixed and Variable Costs Add Together to Yield Total Costs. 5500,000 450.000 5400,000 350.000 2 $300.00 250.000 5200,000 5100,000 50.000 $0 0 1,000 2,000 3000 4000 s000 6,000 7,000 000 9.000 10,000 Units Produced (Q) Cost of Goods Sold Cost of goods sold for manufacturers normally includes both fixed and variable costs of production that can be directly traced to the production of a single product. These costs, from our prion discussion, generally include the costs of direct parts and materials, direct labor costs, and general factory overhead. All are directly attributed to the product (or products) sold. Cost of goods sold does not include fixed and variable marketing costs, including logistics costs. Cost of goods sold for wholesalers and retailers reflect the fact that these intermediaries only resell products made by other firms. As a result, COGS for retailers and wholesalers normally only includes variable costs; specifically, the purchase price of the product plus any inbound freight. The same applies to restaurants. COGS for restaurants are only the variable costs of food and beverages. Labor costs involved for preparation and serving are not normally included. Understanding Margins Gross, Operating, and Net Profit Margins Gross profit margin is the difference between total sales revenue and total cost of goods sold: Gross profit margin can also be expressed on a per unit basis as the difference between price and unit COGS Gross profit margin can also be expressed as either a dollar amount or as a percentage. If expressed as a percentage, it will be as a percentage of either total sales revenue or price. For example assume sales revenue of $50,000. If COGS is $25,000, then gross profit margin may be $25,000 (expressed as a dollar value) or $25,000/$50,000-5 or 50% (expressed as a percentage). These various ways of expressing gross profit margin are summarized in Table 1 below Table 1. Ways of Expressing Gross Profit Margins Total Gross Margin Net Sales Dollars Percent S50 100% COGS Gross Profit Margin $30 60% Unit Gross Margin $1.50 100% Unit COGS Unit Gross Profit Margin $0.90 60% Operating profit margin is total sales revenue - COGS - other fixed & variable costs (excluding interest and taxes). Operating profit margin is also referred to as EBIT (earnings before interest and taxes). The other fixed and variable costs will generally include fixed and variable marketing expenses and other indirect fixed costs that are not directly attributable to production of product (i.e. overhead). Like gross profit margin, operating profit margin can be express as a dollar amount or as a as a percentage. Table 2 below illustrates operating profit margins expressed in dollars and percentage form. Table 2. Expressing Operating Profit in Dollar and Percent Forms Dollar Amount $500,000 Percentage Net sales Cost of goods sold Gross profit margin g expenses Other fixed expenses 1 00% 30% 70% 20% 40% 10 (S150,000 $350,000 (S100,000) ($200,000) 50,000 Marketin Net profit margin is computed by subtracting interest and taxes from operating profit margin. Contribution and Contribution Margin Contribution (also called contribution margin) is an essential metric for marketing managers. Both terms tend to be used interchangeably. However, some practitioners prefer to reserve the term contribution margin for contribution expressed as a percent of sales. We prefer the term "contribution margin but will specifically identify whether contribution margin is to be expressed in currency or as a percent. Contribution margin is hereafter abbreviated as CM. Contribution margin expressed in dollars (or other currency) is essentially the difference between total sales revenue (TSR) and total variable costs (TVC) $CM-TSR-TVC. If expressed as a percent of sales, contribution (% contribution margin) is: %CM-$CM/TSRx 100 Unlike COGS, the variable costs included in computing contribution includevariable costs, not just those related to production. Thus, all production and marketing-related variable costs will be included. Note that if the costs associated with COGS are all variable costs then COGS equals the dollar contribution margin. Contribution margin is considered to be a superior measure of profitability compared to gross profit and net profit because it specifically identifies the relative profitability of individual products and the "contribution" from those products available for covering the Firm's remaining fixed costs. Net Marketing Contribution 1] Moving beyond traditional measures of contribution margin and profit takes us to an examination of a similar metric, net marketing contribution (NMC) is simply that all variable marketing costs (VMC) and direct fixed marketing costs (DFMC) are subtracted from cost of goods sold. The metric more precisely shows managers how well expenditures on marketing are generating profitability for the Firm. It is a valuable metric that assesses the performance of the marketing efforts associated with the product. The relevant formula is: $NMC COGS-VMC-DFMC Net marketing contribution can also be expressed as a percent by dividing the dollar NMC: %NMC-5NMC/TSRx100 If dealing with middlemen or many service industries for which cost of goods sold are all variable, then COGS and dollar contribution margin ($CM) are the same. Thus, $CM already accounts for all variable marketing costs. Further subtracting the direct fixed costs of marketing activities yields the net marketing contribution. Putting It All Together - Building the Income Statement and Contribution Statements The Standard Income Statement Let's begin with an examination of the standard income statement. Assume the following financial data for a hypothetical manufacturer custom furniture, Apex Industries. Apex had sales in the last fiscal year of $10,000,000. Direct production costs included $2,500,000 for parts and materials, plus $1,000,000 in direct labor costs. Marketing expenses included: Sales Force Expenses of $1,000,000 that included salaries for sales manager and sales reps plus administrative costs of running the sales operation. Sales Commissions of $500,000. Sales reps, in addition to their fixed salaries, received a 5% commission on sales. Trade & Media Advertising of $300,000 to stimulate brand awareness and demand for all of Apex's furniture products. Point-of-Sale Media Production Of $100,000. Production of point of sale brochures, flyers, and other materials used by retail sales personnel to support the sale of Apex's products. Coop Ad Allowances of $500,000. A 5% of sales allowance provided to retailers to support local advertising of Apex's line. Shipping Expenses of $800,000 Manufacturing overhead of $800,000. In addition, there were general and administrative expenses (indirect fixed costs) including: Administrative Overhead of $250,000 Executive Salaries and Benefits of $400,000 Table 3 presents a standard income statement that captures these data. Costs of goods sold include the costs of parts and materials, plus the costs of direct labor and manufacturing overhead totaling $4.300.000 and accounting for 43% of revenue. Gross profit is therefore $6,500,000 or 65% of revenue. Marketing expenses include both fixed and variable costs. Sales commissions. cooperative advertising allowance, and shipping are all variable totaling 17% of total revenue. All remaining marketing expenses are direct fixed costs in that they directly support the marketing and sales of Apex's furniture line. Finally, the last category of fixed costs is associated with supporting overall administrative and manufacturing activities. The resulting operating profit before taxes and interest is $1.850.000. The operating profit margin is, therefore, 18.5%. Table 3. Standard Income Statement Total Sales Revenue $10,000,000 100% of Goods Sold Parts & Materials Direct Labor ManufacturmgOverhead $2,500,000 $1,000,000 $800.000 25.00% 1a00% 8,00% S4.300.000 $5,700,000 43.00% 57.00% Profe Margin Expenses Sales Force Expenses Sales Comisions $1,000,000 10.00% 5.00% $500,000 Trade and Media Advertsing 300,000 Point-Of-Sale Materials Production Coop Ad Allowaces $100,000 $500,000 $$10,000 1.00% 5.00% 7.00% Slipping Expabes- $3.200.000 32.00% &Admitistrative Expenses Admin trativeOverhead Executive Salaries & Bettes S250.000 2.50% w0000 4.00% $610000 650% 18.50% Proit The Contribution Statement Let's recast the income statement in Table 3 into what's called a contribution statement. The change is simple. All that we need to do is rearrange some of the costs so that all variable costs are lumped together directly below sales revenue. Table 4 presents the resulting statement. Total variable costs (TVC) are $5,300,000 (53% of sales revenue). Subtracting TVC from sales revenue yields $4,700,000. This is the dollar contribution. Expressed as a percentage, the contribution margin is 47%. Total fixed costs are $1,400,000 + 1,450,000-$2,850,000. Operating profit remains the same as in Table 3 at $1,850,000 or 18.5% of sales revenue Table 4. Contribution Statement Total Sales Reverne Variable Costs $10,000,000 100% Parts & Materials Direct Labor Sales Commisions Coop Ad Allowances, Shipping Expenses $2.500,000 25.00% $1,000,000 10.00% 500,000 5.00% $500,000 5.00% $800000 7.00% $5,300,000 $4,700,000 53.00% 47.00% Contribution Margin Fixed Costs Marketing Expenses Sales Force Expenses Trade & Meda Advertising Point Of Sale Materials production $1,000,000 $300,000 $100,000 10.00% 3.00% 1.00% $1,400,000 14.00% Other Drect and Indrect Fined Costs Administrative Overhead Manufacturing Overhead Executive Salaries & Benefits $250.000 $800,000 $400,000 2.50% 8.00% 4.00% $1,450,000 14.50% The Statement of Net Marketing Contribution One final variation on the income statement derived from the income statement in Table 3 is the Statement of Net Marketing Contribution shown below in Table 5. The highlighted cells in Table 5 separate out the variable marketing costs (VMC) and direct fixed marketing costs (DFMC) from all other costs. Total VMCDFMC equals $3,200,000 resulting in $NMC equal to $2,500,000 and %NMC of 25%. One interprets this latter percent as the percent of each sales dollar available for covering additional fixed expenses and providing for profit. Clearly, management should strive to optimize the percent NMC. Effective and efficient marketing programs should be capable of generating more revenue at lower costs, driving up the magnitude of the %NMC metric. Alternative marketing programs should be compared with one another in terms of their %NMC and $NMC. Marketing programs felt to be deficient based on these metrics are candidates for re- tooling or elimination. Table 5. Statement of Net Marketing Contribution. Total Sales Reveme of Goods Sold $10,000,000 100% Paats & $2,500,000 25.00% $1,000,000 10.00% $800,000 8,00% s4.300.000 5,700,000 57.00% s Proft Magin Expenses S500.000 $800,000 5500,000 $1,000,000 Trade and Mecia Advertisng$300,000 $100,000 Sales Coanusions Shipping Expenses Coop Ad Allowaeces Sales Force Expenses s.00% 7.00% 5.00% 10.00% 3.000% 1.00% Point-Of Sale Materials Prodoction 53,200,000 $2,500,000 32.00% Marketing Contribution 25.00% &Administranive Expenses ative Overhead Exctive Salaries & Benefis $250,000 2.50% 00000 4.00% sesa000 6.50% 1850% Proft Now It's Your Turn. Show Us What You Know Shannon's Brewery is a newly opened micro-brewery of craft beers located about a mile from Samantha Springs in Keller, Texas. According to Shannon Carter, (owner, founder, and brew master) Samantha Springs "is an exceptional water source." "It's surrounded by a very unique rock formation that has veryvery hard compressed rocks that have been hollowed out with this very fine sand. The water travels for miles, and the end product is this filtered water that is just phenomenal." Shannon Carter crafts what the brew master calls "wholesome beers" made with the highest quality, non-GMO grains and malts available and brewed using techniques garnered from his Irish heritage. Shannon's mission statement closely reflects this philosophy. According to Shannon Carter: Our award-winning beer is brewed with the best stuff on earth: pure spring water, whole grain, whole flower hops and a whole lotta love! For us, "brewed with the best stuff on earth," is much more than a saying...it's a guiding principle. Paramount to this commitment is our multi-step fire-brewed process. 12 What makes Shannon's beer great?13 Pure Samantha Springs Water-We start the brewing process with pure Samantha Springs water - straight from the spring, through our filtering system, right into our brewing tanks - no chlorine, fluoride or any other treatments..just pure spring water Fire Brewed Process-Our beer is brewed using an old-world fire-brewed process handed down by the founder's great grandfather. This process enables us to precisely control enzyme activity, produce superlor malty flavors and delicately caramelize our sugars creating truly wonderful and unique beers. All-Natural & Wholesome Ingredients-We use pure spring water, quality malted barley and whole flower hops in all of our brews. This provides our beer a complexity, flavor profile and aroma that is wholesome, natural and truly enjoyable. Patience Great beer takes time- it requires patience in brewing, fermenting and especially aging. Our beers are allowed to age properly, ensuring a wholesome and great tasting been Consider the following revenue and cost data for Shannon's Brewery in Keller, Texas. Shannon's sells 35% of its craft beer production through its own on-premise taproom. The bulk of its sales (65%) are made off-premise via various retail outlets including supermarkets, bars, and restaurants, 40% of its of sales (on-premise and off-premise) consists of package sales (bottles and cans). Of this 40%, beer sold in cans accounts for 80% with sales of bottled beer accounting for the remaining 20%. Finally, the bulk of Shannon's craft beer sales (60%) occurs in kegs (31 gallons per keg) Variable Costs: Beer sold in kegs. Includes the direct costs of ingredients and packaging. Beer sold in bottles and cans. Includes the direct costs of ingredients and packaging. Shrinkage and WIP loss. Losses from theft, damage, deterioration. Direct Labor. Hourly labor costs for production and brew house operations. Contract Labor. Hourly costs of contract labor hired during perlods of peak demand. Shipping. Shipping and handling costs to the wholesaler Fixed Costs: Consumer Advertising. Advertising in local cable TV and print media. Digital Media Promotion. Costs of promotion in social media and website maintenance. Sales Promotion. Brochures, give-away items (specialty items), gifts not considered to be volume sensitive. Salaries and Benefits. Cost of management salaries, retirement, and healthcare benefitsStep by Step Solution
There are 3 Steps involved in it
Step: 1

Get Instant Access to Expert-Tailored Solutions
See step-by-step solutions with expert insights and AI powered tools for academic success
Step: 2

Step: 3
Ace Your Homework with AI
Get the answers you need in no time with our AI-driven, step-by-step assistance
Get Started
Financial Accounting An Integrated Statements Approach
Authors: Jonathan E. Duchac, James M. Reeve, Carl S. Warren
2nd Edition
324312113, 978-0324312119