{ "key_pair_value_system": true, "answer_rating_count": "", "question_feedback_html": { "html_star": "", "html_star_feedback": "" }, "answer_average_rating_value": "", "answer_date_js": "2024-06-10T01:36:45-04:00", "answer_date": "2024-06-10 01:36:45", "is_docs_available": "", "is_excel_available": "", "is_pdf_available": "", "count_file_available": 0, "main_page": "student_question_view", "question_id": "2552430", "url": "\/study-help\/questions\/questions-should-marshall-acquire-electroengineering-inc-ee-what-is-the-2552430", "question_creation_date_js": "2024-06-10T01:36:45-04:00", "question_creation_date": "Jun 10, 2024 01:36 AM", "meta_title": "[Solved] Questions: Should Marshall acquire Electr | SolutionInn", "meta_description": "Answer of - Questions: Should Marshall acquire Electro-Engineering, Inc. (EE)? What is the most important consideration? Even if t | SolutionInn", "meta_keywords": "questions,marshall,acquire,electro-engineering,inc,ee,important,consideration,npv,acquisition,zero,proceed", "question_title_h1": "Questions: Should Marshall acquire Electro-Engineering, Inc. (EE)? What is the most important consideration? Even if the NPV of the acquisition is zero, should she still", "question_title": "Questions: Should Marshall acquire Electro-Engineering, Inc. (EE)? What is the most important", "question_title_for_js_snippet": "Questions Should Marshall acquire Electro Engineering, Inc (EE) What is the most important consideration Even if the NPV of the acquisition is zero, should she still proceed Does the acquisition allow EE to gain enough funding to invest in the purchase of thermowell machines Company Background Burton was engaged primarily in the design and manufacturing of temperature sensors Its products included a variety of highly accurate standard and customized thermocouple sensors, resistance temperature detectors (RTDs), and bearing temperature probes, as well as temperature transmitters Its end users covered a wide range of industries, including oil and gas, petrochemicals, industrial machinery, automotive, food processing, medical, and aerospace While majoring in mechanical engineering, Marshall became interested in sensor technology Shortly after her graduation in 2002, she founded AMI Labs with a loan from her family and began supplying temperature sensors to several local food processors To meet growing demand, she acquired Burton Sensors in 2004 and adopted the target firm's name for the combined enterprise Initially, Burton financed its growth primarily through internally generated cash flows however, Marshall saw that Burton needed more funds than it could generate internally to finance growth opportunities Consequently, Burton had an initial public offering in 2011 Shortly after the equity issuance, Marshall realized that Burton needed yet more financing to expand even further She approached her bank to request a substantial increase in Burton's line of credit in 2013 Exhibits 1, 2, and 3 show Burton's balance sheet, income statement, and statement of cash flows, respectively The Market for Sensors Sensors were essential equipment in many industries 1 They provided vital information about crucial variables such as temperature, position, and pressure that affected products, processes, and systems These variables had to be measured, tested, and monitored, and were often automated 2 Original equipment manufacturers (OEMs) manufactured many types of sensors 3 Among them, temperature sensors had the widest applications for industrial production because temperature affected every aspect of manufacturing it was the most monitored parameter in various end user applications, especially in critical and hazardous applications By product type, the temperature sensors market was classified into seven major segments thermocouples, RTDs, thermistors, infrared temperature sensors, fiber optic temperature sensors, bimetallic temperature sensors, and integrated circuit (IC) temperature sensors Each segment had unique properties and end users Traditional contact types such as RTDs and thermocouples dominated the market, but industry insiders expected the market for fiber optic sensors, which were used primarily in low volume niche applications, would grow more rapidly Compared to traditional sensors, fiber optic sensors had unique properties They were immune to electromagnetic radiation and compatible with high voltage, high radio frequency, and high magnetic field environments These qualities made them ideal for applications in which traditional sensors would fail In addition, they could be positioned in hard to reach or hard to view places and could withstand environments that were more corrosive In the United States, the sensors industry was fragmented and competitive In 2017, over 4,000 sensor OEMs served both the domestic and international markets in the United States Three quarters of these firms had annual sales of less than $10 million Each type of sensor manufacturer faced distinct industry structures and competition Over 200 OEMs produced temperature sensors Most were privately held and family controlled (Exhibit 4 provides financial data on four publicly traded companies in the sensors industry ) Larger firms produced a diversified line of sensors and had more efficient distribution channels To stay competitive, smaller companies like Burton needed to build close relationships with customers and design customized products that met specific customer needs Smaller companies reviewed their distribution networks regularly to ensure that operating expenses were in line with industry norms They also had to expand these networks to grow sales Having experienced sales representatives was often the key to opening new markets Many companies ran large inventory costs because they needed to keep stock for reorders The overall market was expected to grow at a cumulative annual growth rate (CAGR) of 4 5 between 2017 and 2023 and to reach $6 86 billion by 2023 4 The market for fiber optic sensors was expected to have a 15 CAGR and reach $3 5 billion by 2024 The projected growth was attributed largely to high demand for accurate temperature measurement in harsh environments and heavy investment in research and development (R D) by large semiconductor firms The aerospace anddefense, chemical, semiconductor, utilities, metals, medical, construction, and consumer electronics industries had the greatest demand for fiber optic sensors The Bank's Request Burton's bank lender and suppliers supported the company's growth between 2013 and 2016 At the end of 2016, its revolving credit line was $4 58 million It could also borrow at just 2 above the prime rate (3 5 as of February 2017) Nonetheless, Burton's lender had recently expressed concern about the extent to which the company was depending on short term debt to finance its operations When Burton's bank initially agreed to finance Burton's expansion, it expected the industry would soon experience a shakeout, in which weaker competitors would exit and only stronger firms like Burton would remain In turn, Burton expected to increase its operating cash flows once competition had decreased Because Burton had covenanted in its loan agreement not to pay a dividend for several years, any increase in net income would go directly to its retained earnings and reduce the company's ratio of liabilities to equity However, Burton's sales growth outpaced its growth in cash flows The company had to sustain high levels of working capital to support its growth At the end of 2016, Burton's total liabilities were five times its net worth Its outstanding bank loans were 96 of the total value of its accounts receivable and inventory, far in excess of industry norms Burton's bank insisted that the company act to ensure that it would stay safely within the two restrictions that the bank planned to impose on future loans These restrictions, which would apply as of the end of 2017, specified the following 1 The outstanding bank loans at any time should not exceed 75 of the company's accounts receivable and inventory 2 Total liabilities should not exceed three times the book value of equity Marshall had her own target leverage ratio in mind She wanted to hold Burton's ratio of total interest bearing debt to the book value of equity at approximately 1 to 1 Purchasing New Thermowell Machines The thermowell was a major part of the RTD There were many advantages to installing a thermowell with the sensor First, in providing a physical barrier between the production process and the sensing element, the thermowell protected production from corrosive processes, extremely high temperatures, and high pressure Second, it allowed the RTD to be removed and serviced without interfering with the production process Because the temperature had to travel through the metal of the thermowell before reaching the RTD, however, the RTD sensor's response time was reduced The thermowell's quality and design thus affected the RTD's quality Most thermowells were made from carbon steel, stainless steel, nickel, and brass Other chemical compounds such as silicon carbide and silicon nitride were sometimes used to produce thermowells The cost of thermowells was a major component of the production cost of sensors Burton's thermowell equipment allowed it to fulfill only half of its production needs, so the company had to purchase the rest of the equipment from other manufacturers During 2016, Burton spent $1 4 million to purchase thermowells Marshall contacted a large thermowell machinery manufacturer and learned that a purchase of four new thermowell machines for $600,000 would have enabled Burton to manufacture all the thermowells that it purchased in 2016 The equipment would have an economic life of seven years Marshallestimated that Burton would need to hire two operators to run the new machines for $170,000 annually Costs for buying additional materials and renting warehouse space were estimated at $780,000 annually Marshall also estimated that if Burton started manufacturing additional thermowells, its average net working capital needs would increase immediately by $650,000 due to the increase in inventory arising from in house production The working capital would remain at that level during the equipment's life and would return to normal levels afterward Raising Capital by Issuing New Common Stock Marshall knew that Burton had to raise additional equity capital to sustain its projected sales growth while satisfying the covenants of its bank loan She felt that Burton would have difficulty retaining existing customers and attracting new ones if it did not have enough inventory to meet the potential increase in customer orders She was also concerned that restrictions on accepting new orders would make key sales personnel lose confidence in the company's ability to grow, and they could leave to join competitors Burton also needed capital to finance its ongoing R D for new product development to stay competitive and make improvements to existing production facilities Burton's stock was traded on the over the counter (OTC) market The average price in the first two months of 2017 had been $4 75 Given how thin the market was for its shares, the equity beta was challenging to estimate Marshall and her family owned most of Burton's shares The company's remaining equity was held primarily by its employees and other retail investors Raising equity capital through stock issuance in the OTC market seemed unlikely After a private investor approached Marshall and offered to acquire 450,000 shares of the company at $3 50 per share, Marshall approached a friend at a large financial services firm for advice She was told that it would be very difficult for Burton to sell enough stock directly to the market for more than $3 50 a share It seemed that the only realistic prospect for raising new equity capital would be to accept the investor's offer To close the deal, Marshall would also need to pay 50,000 shares to the consulting firm that would broker the deal Acquisition of Electro Engineering, Inc Marshall was also interested in expanding into the fiber optic sensor segment She was assessing whether to purchase Electro Engineering (EE), a small manufacturer of fiber optic sensors based in Gaithersburg, Maryland, that was privately owned EE's unique technology enabled it to construct optical temperature probes from low cost and high strength materials Its sensors were less expensive, more durable, and easier to install than were other competitive optical products EE's financial reports indicated that it had total assets of $2 million and revenues of $4 million in 2016 (Exhibits 5, 6, and 7 show EE's balance sheet, income statement, and statement of cash flows, respectively ) Marshall had investigated EE's operations and the compatibility of its business with Burton's operations She found that, although EE's products were attractive, EE was not operated efficiently She estimated that by giving EE access to Burton's distribution network, EE could reduce its selling, general, and administrative (SG A) expenses from 26 54 to 23 86 annually The combined company could also offer bundled products, which Marshall estimated would enable EE to grow its sales by 24 in 2017, 17 5 in 2018, 15 in 2019, 12 in 2020, and 10 in 2021 Further, by giving EE access to Burton's supply chain, she believed EE could immediately reduce its costs of goods sold from 51 to 49 Finally, she felt that if EE were part of a bigger enterprise, its suppliers would provide better termsof trade credit than they did now She estimated that accounts payable would increase to 4 5 of sales and remain at that level EE's strong balance sheet also attracted Marshall's attention She knew that EE carried a large amount of unsecured debt capacity Through her informal conversation with EE's owner, she learned that he was willing to sell his 100 equity holdings for 10 times 2016 earnings before interest, taxes, depreciation, and amortization in exchange for Burton's common stock, which he valued at $4 75 a share To facilitate the analysis, Marshall asked her assistant to gather the relevant information The yield on the 10 year U S treasury note was 3 The equity risk premium was 5 8 The yield on Baa rated corporate bonds was 4 8 Marshall assumed that EE would maintain its historical ratios of R D expenses and depreciation and amortization as a percentage of sales Exhibit 5 Electro Engineering Consolidated Balance Sheets, 2014 2016 (Fiscal years ending December 31 U S 5000s) 2014 2015 2016 Cash and equivalents 379 1 350 2 359 8 Accounts receivable 485 9 592 0 680 1 Inventory 279 8 413 7 180 6 Prepaid expenses 27 8 5 2 16 9 Current assets 1,172 5 1,361 1 1,537 4 Net PP E 249 1 339 3 479 8 Total assets 1,421 6 1,700 3 2,017 1 Bank loans 340 6 340 6 310 6 Accounts payable 126 6 153 4 175 1 Accrued expenses 104 9 77 0 101 8 Total liabilities 572 1 570 9 587 5 Shareholders' equity 849 5 1,129 4 Total liabilities and equity 1,421 6 1,700 3 1,429 6 2,017 1 Exhibit 6 Electro Engineering Consolidated Income Statements, 2014 2016 (Fiscal years ending December 31 U S 5000s) 2014 2015 2016 Net sales 2,9449 3,566 3 4,072 7 COGS 1,525 0 1,811 7 2,085 2 Gross profit 1,420 0 1,754 6 1,987 5 SGA expense 814 9 930 1 1,080 9 R D expense 153 1 178 3 219 9 Depreciation and amortization 142 2 196 9 206 1 Interest expense 18 7 18 7 18 7 Pretax income (loss) 291 0 430 6 461 8 Income taxes 101 8 150 7 161 6 Net income 189 1 279 9 500 2 Number of common shares (thousands) 1,100 1,100 1,100 Earnings per share 0 17 0 25 0 27 Cash dividend per share 0 0 0 0 0 0Exhibit 7 Consolidated Statement of Cash Flows of Electro Engineering (Actual), 2014 2016 (Fiscal years ending December 31 U S 5000s) 2014 2015 2016 Operating Activities Net income 189 1 279 9 300 2 Depreciation and amortization 142 2 196 9 206 1 Less increase (decrease) in accounts receivable 9 0 106 1 88 1 Less increase (decrease) in inventory (108 5) 133 9 66 9 Less increase (decrease) in prepaid expenses (28 0) (22 6) 11 7 Add increase (decrease) in accounts payable 35 0 26 7 21 8 Add increase (decrease) in accrued expenses 14 0 (27 9) 24 8 Operating activities net cash flow 507 9 258 2 386 1 Investing Activities Less CapEx (230 3) (287 1) (346 6) Investing activities net cash flow (230 3) (287 1) (346 6) Financing Activities Add debt net issuance Add net issuance of common stock (100 0) 0 0 (30 0) 0 0 0 0 Less cash dividend 0 0 0 0 0 0 0 0 Financing activities net cash flow (100 0) 0 0 (30 0) Total net cash flow 177 6 (28 9) 9 6 Beginning cash 201 5 379 1 350 2 Change in cash Ending cash 177 6 (28 9) 9 6 379 1 350 2 359 8Exhibit 1 Burton Sensors Consolidated Balance Sheets (Actual Projected), 2014 2021 (Fiscal years ending December 31 US $000s) 2014A 2015 A 2016A 2017E 2018E 2019E 2020E 2021 E Cash and equivalents 279 7 251 3 3043 371 3 359 7 368 6 437 5 484 6 Accounts receivable 1,5525 1,894 0 2,3154 2,824 9 3,276 9 3,539 1 3,751 4 3,9765 (245 of projected sales) Inventory 1,672 9 2,096 7 2,436 3 2,997 9 3,477 6 3,755 8 3,981 1 4,220 0 (26 of projected sales) Other current assets 253 5 311 8 371 9 461 2 535 0 5778 612 5 649 2 (4 of projected sales) Current assets 3,758 6 4,553 8 5427 8 6,655 3 7,649 2 8,2413 8,782 5 93303 Net PP E 3,874 0 4,293 3 4,654 1 4,847 8 4,938 8 4,875 2 4,789 5 4,698 6 Total assets 7632 6 8,847 2 10,082 0 11,503 2 12,588 0 13,1165 13,572 0 14,028 9 Accounts payable 773 1 935 3 1,153 0 1,383 6 1,605 0 1,733 4 1,837 4 1,947 7 (12 of projected sales) Accrued expenses 418 2 491 0 567 2 714 9 829 3 895 6 949 3 1,0063 (6 2 of projected sales) Bank loans 3,020 0 3,880 0 4,580 0 5,080 0 5,230 0 4,930 0 4,530 0 4,030 0 Deferred taxes 351 9 360 7 406 2 527 9 590 1 624 0 658 3 702 5 Long term debt, current portion 150 0 150 0 150 0 150 0 150 0 150 0 150 0 150 0 Current Liabilities 4,713 2 5,817 0 6,8565 7,856 4 8,404 4 8,333 1 8,125 1 7,8365 Long term debt 1,980 0 1,830 0 1,680 0 1,530 0 1,380 0 1,230 0 1,080 0 930 0 Total liabilities 6,693 2 7,647 0 8,5365 9,386 4 9,784 4 9,563 1 9,205 1 8,7665 Shareholders' equity 9394 1,200 1 1,545 5 2,116 8 2,813 6 3,5534 4,366 9 5,2624 Total liabilities and equity 7632 6 8,847 2 10,082 0 11,503 2 12,588 0 13,1165 13,572 0 14,028 9 Bank loan (receivables inventory) 0 94 0 97 0 96 087 0 77 0 68 0 59 0 49 Liabilities book equity 7 1x 64x 5 5x 4 Ax 3 5x 2 7x 2 1x 1 7x Total interest bearing debt book equity 5 5x 4 9x 4 1x 3 2x 2 4x 1 8x 1 3x 1 0xExhibit 2 Burton Sensors Consolidated Income Statements (Actual Projected), 2014 2021 (Fiscal years ending December 31 U S $000s) 2014 A 2015 A 2016 A 2017E 201SE 2019E 202 0E 2021E Net sales 6,336 9 7,7944 9,298 7 11,530 4 13,375 3 14,A453 15,312 0 16,230 7 COGS 2,6868 33594 4,035 6 4,958 1 5,751 4 6,211 5 6,584 2 6,979 2 Gross profit (43 of projected sales) 3,650 1 4,435 0 5 263 1 6,572 3 7,623 9 8,233 8 8,7278 9,2515 SG A expense 2,230 6 2,7904 3,263 8 4,035 6 4,681 3 5,055 8 5,3592 R D expense 5,6807 (35 of projected sales) 697 1 8574 1,022 9 1,153 0 1,337 5 1,A445 1,531 2 1,623 1 Depreciation and amortization (10 of projected sales) 98 9 102 9 122 7 152 2 176 6 208 0 238 9 253 2 Net interest expense (income) 2475 283 3 322 3 352 6 371 8 371 8 347 1 316 8 Pretax income (loss) 376 1 401 1 5313 878 9 1,056 7 1,153 6 1,2515 1,3777 Income taxes 131 6 1404 186 0 307 6 369 8 403 8 438 0 Net income 482 2 (35 of projected EBT) 2444 260 7 3454 571 3 686 8 749 9 8135 895 5 Number of common shares (thousands) 1,500 1,500 1,500 1,500 1,500 1,500 1,500 1,500 Earnings per share 0 16 0 17 0 23 0 38 0 46 0 50 0 54 0 60 Cash dividend per share S S Burton pays an average of 5 5 interest on all interest bearing income Exhibit 3 Burton Sensors Consolidated Statement of Cash Flows (Actual Projected), 2014 2021 (Fiscal years ending December 31 US $000s) 2014A 2015 A 2016A 2017E 2018E 2019E 2020 E 20211 Operating Activities Net income 244 4 260 7 3454 571 3 686 8 749 9 813 5 895 5 Depreciation and amortization 98 9 102 9 122 7 152 2 176 6 208 0 238 9 253 2 Less increase (decrease) in accounts receivable 320 0 341 5 4213 509 6 452 0 262 2 212 3 225 1 Less increase (decrease) in inventory 289 8 423 7 339 6 561 6 479 7 278 2 225 3 238 9 Less increase (decrease) in other current assets 55 6 58 3 60 2 89 3 73 8 42 8 34 7 36 7 Add increase (decrease) in accounts payable 120 3 162 2 217 7 230 6 2214 128 4 104 0 110 2 Add increase (decrease) in accrued expenses 30 2 72 8 76 2 147 7 114 4 66 3 53 7 57 0 Add increase (decrease) in deferred taxes (163 9) 45 6 121 7 62 2 33 9 34 3 44 2 Operating activities net cash flow (335 5) (216 1) (13 5) 62 9 255 9 603 4 772 0 8594 Investing Activities Less CapEx (351 9) (522 2) (483 5) 345 9) (267 5) (144 5 (153 1) (162 3) Investing activities net cash flow (354 9) (522 2) (483 5) (345 9) (267 5) (144 5) (153 1) (162 3) Financing Activities Add changes in bank borrowings 800 0 860 0 700 0 500 0 150 0 (300 0) (400 0) (500 0) Add long term debt net issuance (150 0) (150 0) (150 0) (150 0) (150 0) (150 0) (150 0) (150 0) Add net issuance of common stock 0 0 0 0 Less cash dividend 0 0 0 0 0 0 Financing activities net cash flow 650 0 710 0 550 0 350 0 (450 0) (550 0) (650 0) Total net cash flow (40 3) (284) 53 0 67 0 (11 6) 68 9 47 1 Beginning cash 320 0 279 7 251 3 304 3 3713 359 7 368 6 437 5 Change in cash (40 3) (284) 53 0 67 0 (11 6) 8 9 68 9 47 1 Ending cash 279 7 251 3 3043 371 3 359 7 368 6 437 5 484 6Exhibit 4 Comparative Data for Four Publicly Traded Sensor Manufacturers, 2014 2016 ($US millions) TE Connectivity (TEL) Ametck (AME) Opsens (OPS) Cyberoptics (CYBE) 201 4 2015 2016 2014 2015 2016 2014 2015 201 6 2014 2015 2016 Net sales 12,233 00 12,238 00 13,113,00 3,974 30 3,840 09 4,300 17 5 21 9 60 17 75 41 13 66 24 53 33 Operating profit 1,992 00 1,936 00 2 201 00 944 32 841 40 931 89 (5 13) (8 49) (6 38) (2 20) 6 15 1 02 Net income 2,420 00 2,009 00 1,683 00 590 86 512 16 681 47 (2 88) (9 28) (6 54) (2 10) 11 56 2 00 Assets 20,589 00 17,60800 19403 00 6,660 45 7100 67 7,796 06 12 76 16 86 27 61 44 74 59 58 59 50 Total debt 3,884 00 4,070 00 4,344 00 1,866 12 2,062 64 1,866 17 3 69 5 58 5 30 I Total liabilities 11,004 00 9,123 00 9,652 00 3,405 82 3 ,844 16 3,768 43 6 87 9 55 9 64 8 68 10 68 7 22 Shareholders' equity 9,585 00 8,485 00 9,751 00 3,254 63 3,256 51 4,027 63 5 89 7 31 17 97 36 06 48 90 52 28 Operating margin 0 16 0 16 0 17 0 24 0 22 0 22 (0 99) (0 88) (036) (0 05) 0 09 0 02 Profit margin 0 20 0 16 0 13 0 15 0 13 0 16 (0 55) (0 97) (0 37) (0 05) 0 17 0 04 Shares outstanding 405 00 366 00 355 00 239 91 232 59 230 23 60 18 66 74 80 95 6 71 6 83 6 95 Market capitalization 24,959 14 24,618 77 33490 92 12,748 27 15,280 00 16,940 38 51 75 108 11 90 67 5130 191 30 114 61 Equity beta 1 30 1 26 1 24 1 29 1 16 1 25 1 32 1 17 1 02 0 82 0 80 0 85 EPS 5 98 549 4 74 2 46 2 20 2 96 (0 05) (0 14) (0 08) (0 31) 1 69 0 29 P E 10 31 12 25 19 90 21 58 29 83 24 86 NA NA NA NA 16 55 57 30 D Marketcap 0 16 0 17 0 13 0 15 0 13 0 11 0 07 0 05 0 06 Based on previous five years", "question_description": "\"image\"image\"image\"image\"image\"image

Questions: Should Marshall acquire Electro-Engineering, Inc. (EE)? What is the most important consideration? Even if the NPV of the acquisition is zero, should she still proceed?<\/p>

Does the acquisition allow EE to gain enough funding to invest in the purchase of thermowell machines?<\/p>

<\/p>

<\/p>

<\/p>

Company Background<\/p>

<\/p>

Burton was engaged primarily in the design and manufacturing of temperature sensors. Its products included a variety of highly accurate standard and customized thermocouple sensors, resistance temperature detectors (RTDs), and bearing temperature probes, as well as temperature transmitters. Its end users covered a wide range of industries, including oil and gas, petrochemicals, industrial machinery, automotive, food processing, medical, and aerospace.<\/p>

<\/p>

While majoring in mechanical engineering, Marshall became interested in sensor technology. Shortly after her graduation in 2002, she founded AMI Labs with a loan from her family and began supplying temperature sensors to several local food processors. To meet growing demand, she acquired Burton Sensors in 2004 and adopted the target firm's name for the combined enterprise.<\/p>

<\/p>

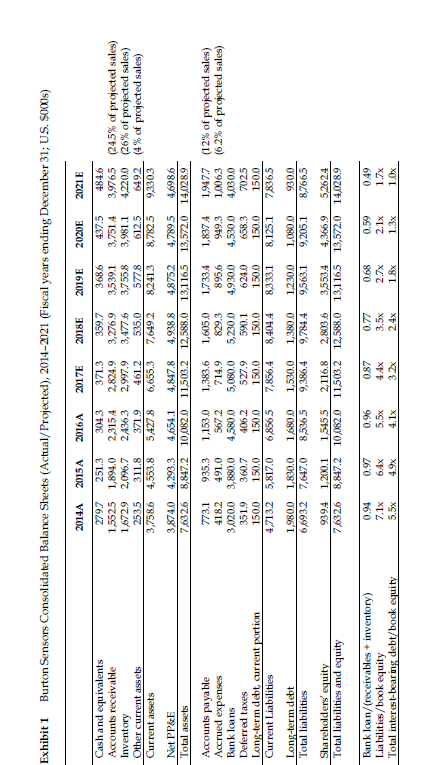
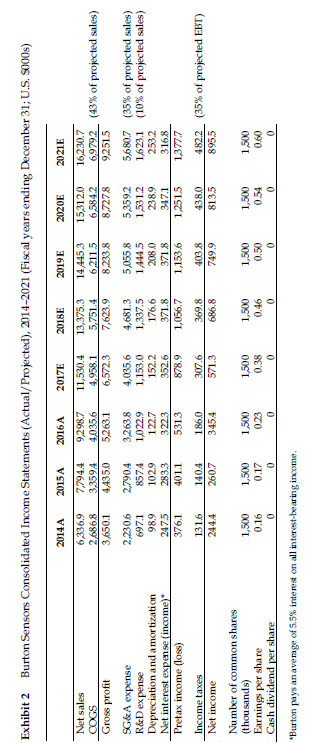
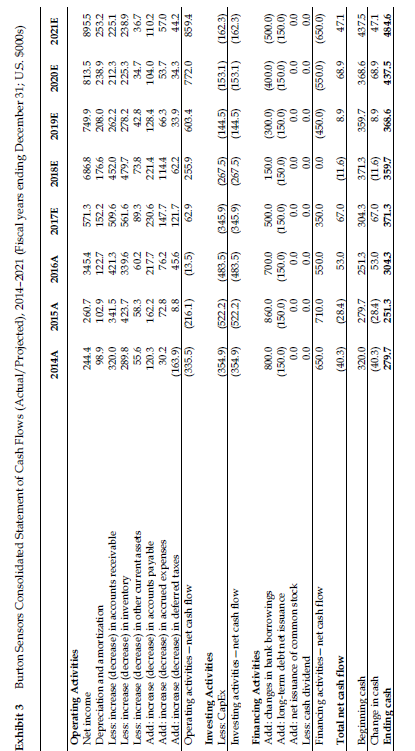
Initially, Burton financed its growth primarily through internally generated cash flows; however, Marshall saw that Burton needed more funds than it could generate internally to finance growth opportunities. Consequently, Burton had an initial public offering in 2011. Shortly after the equity issuance, Marshall realized that Burton needed yet more financing to expand even further. She approached her bank to request a substantial increase in Burton's line of credit in 2013. Exhibits 1, 2, and 3 show Burton's balance sheet, income statement, and statement of cash flows, respectively.<\/p>

<\/p>

The Market for Sensors<\/p>

<\/p>

Sensors were essential equipment in many industries.1 They provided vital information about crucial variables such as temperature, position, and pressure that affected products, processes, and systems. These variables had to be measured, tested, and monitored, and were often automated.2 Original equipment manufacturers (OEMs) manufactured many types of sensors.3 Among them, temperature sensors had the widest applications for industrial production because temperature affected every aspect of manufacturing; it was the most monitored parameter in various end-user applications, especially in critical and hazardous applications.<\/p>

<\/p>

By product type, the temperature sensors market was classified into seven major segments: thermocouples, RTDs, thermistors, infrared temperature sensors, fiber-optic temperature sensors, bimetallic temperature sensors, and integrated circuit (IC) temperature sensors. Each segment had unique properties and end users. Traditional contact types such as RTDs and thermocouples dominated the market, but industry insiders expected the market for fiber-optic sensors, which were used primarily in low-volume niche applications, would grow more rapidly. Compared to traditional sensors, fiber-optic sensors had unique properties. They were immune to electromagnetic radiation and compatible with high-voltage, high-radio frequency, and high-magnetic field environments. These qualities made them ideal for applications in which traditional sensors would fail. In addition, they could be positioned in hard-to-reach or hard-to-view places and could withstand environments that were more corrosive.<\/p>

<\/p>

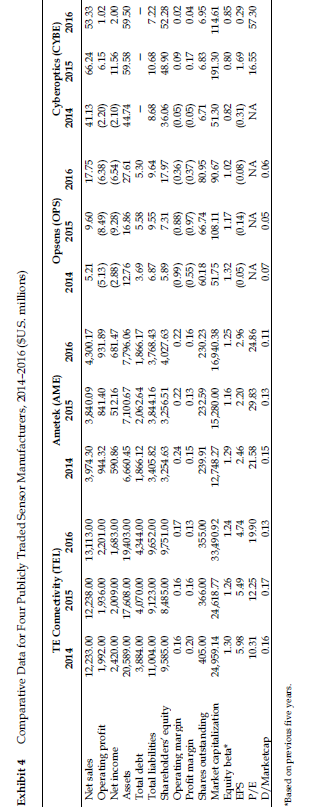
In the United States, the sensors industry was fragmented and competitive. In 2017, over 4,000 sensor OEMs served both the domestic and international markets in the United States. Three-quarters of these firms had annual sales of less than $10 million. Each type of sensor manufacturer faced distinct industry structures and competition. Over 200 OEMs produced temperature sensors. Most were privately held and family controlled. (Exhibit 4 provides financial data on four publicly-traded companies in the sensors industry.) Larger firms produced a diversified line of sensors and had more efficient distribution channels. To stay competitive, smaller companies like Burton needed to build close relationships with customers and design customized products that met specific customer needs. Smaller companies reviewed their distribution networks regularly to ensure that operating expenses were in line with industry norms. They also had to expand these networks to grow sales. Having experienced sales representatives was often the key to opening new markets. Many companies ran large inventory costs because they needed to keep stock for reorders.<\/p>

<\/p>

The overall market was expected to grow at a cumulative annual growth rate (CAGR) of 4.5% between 2017 and 2023 and to reach $6.86 billion by 2023.4 The market for fiber-optic sensors was expected to have a 15% CAGR and reach $3.5 billion by 2024. The projected growth was attributed largely to high demand for accurate temperature measurement in harsh environments and heavy investment in research and development (R&D) by large semiconductor firms. The aerospace anddefense, chemical, semiconductor, utilities, metals, medical, construction, and consumer electronics industries had the greatest demand for fiber-optic sensors.<\/p>

<\/p>

The Bank's Request<\/p>

<\/p>

Burton's bank lender and suppliers supported the company's growth between 2013 and 2016. At the end of 2016, its revolving credit line was $4.58 million. It could also borrow at just 2% above the prime rate (3.5% as of February 2017). Nonetheless, Burton's lender had recently expressed concern about the extent to which the company was depending on short-term debt to finance its operations.<\/p>

<\/p>

When Burton's bank initially agreed to finance Burton's expansion, it expected the industry would soon experience a shakeout, in which weaker competitors would exit and only stronger firms like Burton would remain. In turn, Burton expected to increase its operating cash flows once competition had decreased. Because Burton had covenanted in its loan agreement not to pay a dividend for several years, any increase in net income would go directly to its retained earnings and reduce the company's ratio of liabilities to equity.<\/p>

<\/p>

However, Burton's sales growth outpaced its growth in cash flows. The company had to sustain high levels of working capital to support its growth. At the end of 2016, Burton's total liabilities were five times its net worth. Its outstanding bank loans were 96% of the total value of its accounts receivable and inventory, far in excess of industry norms. Burton's bank insisted that the company act to ensure that it would stay safely within the two restrictions that the bank planned to impose on future loans. These restrictions, which would apply as of the end of 2017, specified the following:<\/p>

<\/p>

1. The outstanding bank loans at any time should not exceed 75% of the company's accounts receivable and inventory.<\/p>

<\/p>

2. Total liabilities should not exceed three times the book value of equity.<\/p>

<\/p>

Marshall had her own target leverage ratio in mind. She wanted to hold Burton's ratio of total interest-bearing debt to the book value of equity at approximately 1 to 1.<\/p>

<\/p>

Purchasing New Thermowell Machines<\/p>

<\/p>

The thermowell was a major part of the RTD. There were many advantages to installing a thermowell with the sensor. First, in providing a physical barrier between the production process and the sensing element, the thermowell protected production from corrosive processes, extremely high temperatures, and high pressure. Second, it allowed the RTD to be removed and serviced without interfering with the production process. Because the temperature had to travel through the metal of the thermowell before reaching the RTD, however, the RTD sensor's response time was reduced. The thermowell's quality and design thus affected the RTD's quality. Most thermowells were made from carbon steel, stainless steel, nickel, and brass. Other chemical compounds such as silicon carbide and silicon nitride were sometimes used to produce thermowells. The cost of thermowells was a major component of the production cost of sensors. Burton's thermowell equipment allowed it to fulfill only half of its production needs, so the company had to purchase the rest of the equipment from other manufacturers. During 2016, Burton spent $1.4 million to purchase thermowells.<\/p>

<\/p>

Marshall contacted a large thermowell machinery manufacturer and learned that a purchase of four new thermowell machines for $600,000 would have enabled Burton to manufacture all the thermowells that it purchased in 2016. The equipment would have an economic life of seven years. Marshallestimated that Burton would need to hire two operators to run the new machines for $170,000 annually. Costs for buying additional materials and renting warehouse space were estimated at $780,000 annually. Marshall also estimated that if Burton started manufacturing additional thermowells, its average net working capital needs would increase immediately by $650,000 due to the increase in inventory arising from in-house production. The working capital would remain at that level during the equipment's life and would return to normal levels afterward.<\/p>

<\/p>

Raising Capital by Issuing New Common Stock<\/p>

<\/p>

Marshall knew that Burton had to raise additional equity capital to sustain its projected sales growth while satisfying the covenants of its bank loan. She felt that Burton would have difficulty retaining existing customers and attracting new ones if it did not have enough inventory to meet the potential increase in customer orders. She was also concerned that restrictions on accepting new orders would make key sales personnel lose confidence in the company's ability to grow, and they could leave to join competitors. Burton also needed capital to finance its ongoing R&D for new product development to stay competitive and make improvements to existing production facilities.<\/p>

<\/p>

Burton's stock was traded on the over-the-counter (OTC) market. The average price in the first two months of 2017 had been $4.75. Given how thin the market was for its shares, the equity beta was challenging to estimate. Marshall and her family owned most of Burton's shares. The company's remaining equity was held primarily by its employees and other retail investors. Raising equity capital through stock issuance in the OTC market seemed unlikely.<\/p>

<\/p>

After a private investor approached Marshall and offered to acquire 450,000 shares of the company at $3.50 per share, Marshall approached a friend at a large financial services firm for advice. She was told that it would be very difficult for Burton to sell enough stock directly to the market for more than $3.50 a share. It seemed that the only realistic prospect for raising new equity capital would be to accept the investor's offer. To close the deal, Marshall would also need to pay 50,000 shares to the consulting firm that would broker the deal.<\/p>

<\/p>

Acquisition of Electro-Engineering, Inc.<\/p>

<\/p>

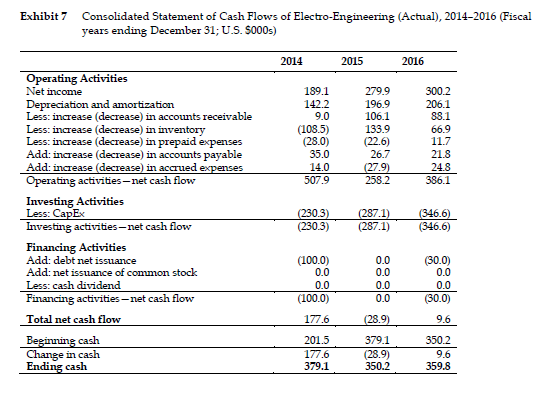
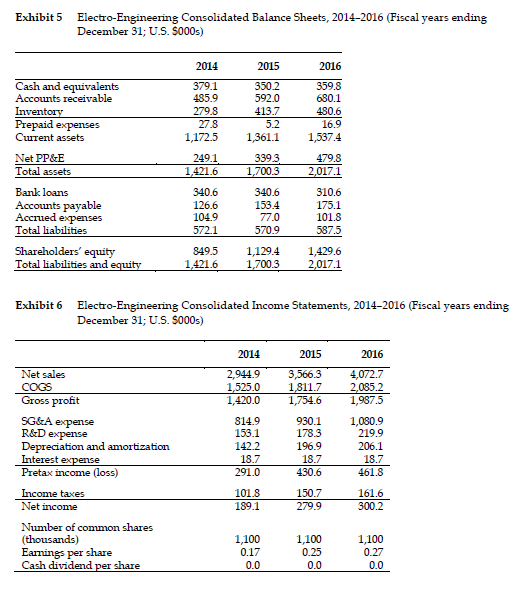
Marshall was also interested in expanding into the fiber-optic sensor segment. She was assessing whether to purchase Electro-Engineering (EE), a small manufacturer of fiber-optic sensors based in Gaithersburg, Maryland, that was privately owned. EE's unique technology enabled it to construct optical temperature probes from low-cost and high-strength materials. Its sensors were less expensive, more durable, and easier to install than were other competitive optical products. EE's financial reports indicated that it had total assets of $2 million and revenues of $4 million in 2016. (Exhibits 5, 6, and 7 show EE's balance sheet, income statement, and statement of cash flows, respectively.)<\/p>

<\/p>

Marshall had investigated EE's operations and the compatibility of its business with Burton's operations. She found that, although EE's products were attractive, EE was not operated efficiently. She estimated that by giving EE access to Burton's distribution network, EE could reduce its selling, general, and administrative (SG&A) expenses from 26.54% to 23.86% annually. The combined company could also offer bundled products, which Marshall estimated would enable EE to grow its sales by 24% in 2017, 17.5% in 2018, 15% in 2019, 12% in 2020, and 10% in 2021. Further, by giving EE access to Burton's supply chain, she believed EE could immediately reduce its costs of goods sold from 51% to 49%. Finally, she felt that if EE were part of a bigger enterprise, its suppliers would provide better termsof trade credit than they did now. She estimated that accounts payable would increase to 4.5% of sales and remain at that level.<\/p>

<\/p>

EE's strong balance sheet also attracted Marshall's attention. She knew that EE carried a large amount of unsecured debt capacity. Through her informal conversation with EE's owner, she learned that he was willing to sell his 100% equity holdings for 10 times 2016 earnings before interest, taxes, depreciation, and amortization in exchange for Burton's common stock, which he valued at $4.75 a share.<\/p>

<\/p>

To facilitate the analysis, Marshall asked her assistant to gather the relevant information. The yield on the 10-year U.S. treasury note was 3%. The equity-risk premium was 5.8%. The yield on Baa-rated corporate bonds was 4.8%. Marshall assumed that EE would maintain its historical ratios of R&D expenses and depreciation and amortization as a percentage of sales.<\/p>

\"image\"image\"image\"image\"image\"image<\/div><\/div><\/div> Exhibit 5 Electro-Engineering Consolidated Balance Sheets, 2014-2016 (Fiscal years ending December 31; U.S. 5000s) 2014 2015 2016 Cash and equivalents 379.1 350.2 359.8 Accounts receivable 485.9 592.0 680.1 Inventory 279.8 413.7 180.6 Prepaid expenses 27.8 5.2 16.9 Current assets 1,172.5 1,361.1 1,537.4 Net PP&E 249.1 339.3 479.8 Total assets 1,421 6 1,700.3 2,017.1 Bank loans 340.6 340.6 310.6 Accounts payable 126.6 153.4 175.1 Accrued expenses 104.9 77.0 101.8 Total liabilities 572.1 570.9 587.5 Shareholders' equity 849.5 1,129.4 Total liabilities and equity 1,421.6 1,700.3 1,429.6 2,017.1 Exhibit 6 Electro-Engineering Consolidated Income Statements, 2014-2016 (Fiscal years ending December 31; U.S. 5000s) 2014 2015 2016 Net sales 2,9449 3,566.3 4,072.7 COGS 1,525.0 1,811.7 2,085.2 Gross profit 1,420.0 1,754.6 1,987.5 SGA expense 814.9 930.1 1,080.9 R&D expense 153.1 178.3 219.9 Depreciation and amortization 142.2 196.9 206.1 Interest expense 18.7 18.7 18.7 Pretax income (loss) 291.0 430.6 461.8 Income taxes 101.8 150.7 161.6 Net income 189.1 279.9 500.2 Number of common shares (thousands) 1,100 1,100 1,100 Earnings per share 0.17 0.25 0.27 Cash dividend per share 0.0 0.0 0.0Exhibit 7 Consolidated Statement of Cash Flows of Electro-Engineering (Actual), 2014-2016 (Fiscal years ending December 31; U.S. 5000s) 2014 2015 2016 Operating Activities Net income 189.1 279.9 300.2 Depreciation and amortization 142.2 196.9 206.1 Less: increase (decrease) in accounts receivable 9.0 106.1 88.1 Less: increase (decrease) in inventory (108.5) 133.9 66.9 Less: increase (decrease) in prepaid expenses (28.0) (22.6) 11.7 Add: increase (decrease) in accounts payable 35.0 26.7 21.8 Add: increase (decrease) in accrued expenses 14.0 (27.9) 24.8 Operating activities - net cash flow 507.9 258.2 386.1 Investing Activities Less: CapEx (230.3) (287.1) (346.6) Investing activities- net cash flow (230.3) (287.1) (346.6) Financing Activities Add: debt net issuance Add: net issuance of common stock (100.0) 0.0 (30.0) 0.0 0.0 Less: cash dividend 0.0 0.0 0.0 0.0 Financing activities - net cash flow (100.0) 0.0 (30.0) Total net cash flow 177.6 (28.9) 9.6 Beginning cash 201.5 379.1 350.2 Change in cash Ending cash 177.6 (28.9) 9.6 379.1 350.2 359.8Exhibit 1 Burton Sensors Consolidated Balance Sheets (Actual\/Projected), 2014-2021 (Fiscal years ending December 31; US. $000s) 2014A 2015 A 2016A 2017E 2018E 2019E 2020E 2021 E Cash and equivalents 279.7 251.3 3043 371.3 359.7 368.6 437.5 484.6 Accounts receivable 1,5525 1,894.0 2,3154 2,824.9 3,276.9 3,539.1 3,751 4 3,9765 (245% of projected sales) Inventory 1,672.9 2,096.7 2,436.3 2,997.9 3,477 .6 3,755.8 3,981.1 4,220.0 (26% of projected sales) Other current assets 253.5 311.8 371.9 461.2 535.0 5778 612.5 649.2 (4% of projected sales) Current assets 3,758.6 4,553.8 5427 8 6,655.3 7,649.2 8,2413 8,782.5 93303 Net PP&E 3,874.0 4,293.3 4,654.1 4,847.8 4,938 8 4,875.2 4,789.5 4,698.6 Total assets 7632.6 8,847.2 10,082.0 11,503.2 12,588.0 13,1165 13,572.0 14,028.9 Accounts payable 773.1 935.3 1,153.0 1,383.6 1,605.0 1,733.4 1,837 4 1,947.7 (12% of projected sales) Accrued expenses 418.2 491.0 567 2 714.9 829.3 895.6 949.3 1,0063 (6.2% of projected sales) Bank loans 3,020.0 3,880.0 4,580.0 5,080.0 5,230.0 4,930.0 4,530.0 4,030.0 Deferred taxes 351.9 360.7 406.2 527.9 590.1 624.0 658.3 702.5 Long-term debt, current portion 150.0 150.0 150.0 150.0 150.0 150.0 150.0 150.0 Current Liabilities 4,713.2 5,817.0 6,8565 7,856.4 8,404.4 8,333.1 8,125.1 7,8365 Long-term debt 1,980.0 1,830.0 1,680.0 1,530.0 1,380.0 1,230.0 1,080.0 930.0 Total liabilities 6,693.2 7,647.0 8,5365 9,386.4 9,784 4 9,563.1 9,205.1 8,7665 Shareholders' equity 9394 1,200.1 1,545 5 2,116.8 2,813.6 3,5534 4,366.9 5,2624 Total liabilities and equity 7632.6 8,847.2 10,082.0 11,503.2 12,588.0 13,1165 13,572.0 14,028.9 Bank loan\/(receivables + inventory) 0.94 0.97 0.96 087 0.77 0.68 0.59 0.49 Liabilities \/ book equity 7.1x 64x 5.5x 4.Ax 3.5x 2.7x 2.1x 1.7x Total interest-bearing debt\/book equity 5.5x 4.9x 4.1x 3.2x 2.4x 1 8x 1.3x 1.0xExhibit 2 Burton Sensors Consolidated Income Statements (Actual\/Projected), 2014-2021 (Fiscal years ending December 31; U.S. $000s) 2014 A 2015 A 2016 A 2017E 201SE 2019E 202 0E 2021E Net sales 6,336.9 7,7944 9,298.7 11,530.4 13,375.3 14,A453 15,312.0 16,230.7 COGS 2,6868 33594 4,035.6 4,958.1 5,751.4 6,211 5 6,584.2 6,979.2 Gross profit (43% of projected sales) 3,650.1 4,435.0 5.263.1 6,572.3 7,623.9 8,233 8 8,7278 9,2515 SG&A expense 2,230.6 2,7904 3,263.8 4,035.6 4,681.3 5,055 8 5,3592 R&D expense 5,6807 (35% of projected sales) 697.1 8574 1,022.9 1,153.0 1,337.5 1,A445 1,531.2 1,623.1 Depreciation and amortization (10% of projected sales) 98.9 102.9 122.7 152.2 176.6 208.0 238.9 253.2 Net interest expense (income)\" 2475 283.3 322.3 352.6 371.8 371.8 347.1 316.8 Pretax income (loss) 376.1 401.1 5313 878.9 1,056.7 1,153.6 1,2515 1,3777 Income taxes 131.6 1404 186.0 307.6 369.8 403.8 438.0 Net income 482.2 (35% of projected EBT) 2444 260.7 3454 571.3 686.8 749.9 8135 895.5 Number of common shares (thousands) 1,500 1,500 1,500 1,500 1,500 1,500 1,500 1,500 Earnings per share 0.16 0.17 0.23 0.38 0.46 0.50 0.54 0.60 Cash dividend per share S S Burton pays an average of 5.5% interest on all interest-bearing income.Exhibit 3 Burton Sensors Consolidated Statement of Cash Flows (Actual\/Projected), 2014-2021 (Fiscal years ending December 31; US. $000s) 2014A 2015 A 2016A 2017E 2018E 2019E 2020 E 20211 Operating Activities Net income 244.4 260.7 3454 571.3 686.8 749.9 813.5 895.5 Depreciation and amortization 98.9 102.9 122.7 152.2 176.6 208.0 238.9 253.2 Less: increase (decrease) in accounts receivable 320.0 341.5 4213 509.6 452.0 262.2 212.3 225.1 Less: increase (decrease) in inventory 289.8 423.7 339.6 561.6 479.7 278.2 225.3 238.9 Less: increase (decrease) in other current assets 55.6 58.3 60.2 89.3 73.8 42.8 34.7 36.7 Add: increase (decrease) in accounts payable 120.3 162.2 217.7 230.6 2214 128.4 104.0 110.2 Add: increase (decrease) in accrued expenses 30.2 72.8 76.2 147.7 114.4 66.3 53.7 57.0 Add: increase (decrease) in deferred taxes (163.9) 45.6 121.7 62.2 33.9 34.3 44.2 Operating activities -net cash flow (335.5) (216.1) (13.5) 62.9 255.9 603.4 772.0 8594 Investing Activities Less: CapEx (351.9) (522.2) (483.5) 345.9) (267 5) (144.5 (153.1) (162.3) Investing activities - net cash flow (354.9) (522.2) (483.5) (345.9) (267 5) (144.5) (153.1) (162.3) Financing Activities Add: changes in bank borrowings 800.0 860.0 700.0 500.0 150.0 (300.0) (400.0) (500.0) Add: long-term debt net issuance (150.0) (150.0) (150.0) (150.0) (150.0) (150.0) (150.0) (150.0) Add: net issuance of common stock 0.0 0.0 Less: cash dividend 0.0 0.0 0.0 Financing activities- net cash flow 650.0 710.0 550.0 350.0 (450.0) (550.0) (650.0) Total net cash flow (40.3) (284) 53.0 67.0 (11.6) 68.9 47.1 Beginning cash 320.0 279.7 251.3 304.3 3713 359.7 368.6 437.5 Change in cash (40.3) (284) 53.0 67.0 (11.6) 8.9 68.9 47.1 Ending cash 279.7 251.3 3043 371.3 359.7 368.6 437.5 484.6Exhibit 4 Comparative Data for Four Publicly Traded Sensor Manufacturers, 2014-2016 ($US. millions) TE Connectivity (TEL) Ametck (AME) Opsens (OPS) Cyberoptics (CYBE) 201 4 2015 2016 2014 2015 2016 2014 2015 201 6 2014 2015 2016 Net sales 12,233.00 12,238.00 13,113,00 3,974.30 3,840.09 4,300.17 5.21 9.60 17.75 41.13 66.24 53.33 Operating profit 1,992.00 1,936.00 2.201.00 944.32 841.40 931.89 (5.13) (8.49) (6.38) (2.20) 6.15 1.02 Net income 2,420.00 2,009.00 1,683.00 590.86 512.16 681.47 (2.88) (9.28) (6.54) (2.10) 11.56 2.00 Assets 20,589.00 17,60800 19403.00 6,660.45 7100.67 7,796.06 12.76 16.86 27.61 44.74 59.58 59.50 Total debt 3,884.00 4,070.00 4,344.00 1,866.12 2,062.64 1,866.17 3.69 5.58 5.30 I - Total liabilities 11,004.00 9,123.00 9,652.00 3,405 82 3 ,844.16 3,768.43 6.87 9.55 9.64 8.68 10.68 7.22 Shareholders' equity 9,585.00 8,485.00 9,751.00 3,254.63 3,256.51 4,027.63 5.89 7.31 17.97 36.06 48.90 52.28 Operating margin 0.16 0.16 0.17 0.24 0.22 0.22 (0.99) (0.88) (036) (0.05) 0.09 0.02 Profit margin 0.20 0.16 0.13 0.15 0.13 0.16 (0.55) (0.97) (0.37) (0.05) 0.17 0.04 Shares outstanding 405.00 366.00 355.00 239.91 232.59 230.23 60.18 66.74 80.95 6.71 6.83 6.95 Market capitalization 24,959.14 24,618.77 33490.92 12,748.27 15,280.00 16,940.38 51.75 108.11 90.67 5130 191.30 114.61 Equity beta\" 1.30 1.26 1.24 1.29 1.16 1.25 1.32 1.17 1.02 0.82 0.80 0.85 EPS 5.98 549 4.74 2.46 2.20 2.96 (0.05) (0.14) (0.08) (0.31) 1.69 0.29 P\/E 10.31 12.25 19.90 21.58 29.83 24.86 NA NA NA NA 16.55 57 30 D\/Marketcap 0.16 0.17 0.13 0.15 0.13 0.11 0.07 0.05 0.06 \"Based on previous five years", "transcribed_text": "", "related_book": { "title": "Managerial Accounting An Introduction to Concepts Methods and Uses", "isbn": "1111822239, 324639767, 9781111822231, 978-0324639766", "edition": "10th Edition", "authors": "Michael W. Maher, Clyde P. Stickney, Roman L. Weil", "cover_image": "https:\/\/dsd5zvtm8ll6.cloudfront.net\/si.question.images\/book_images\/137.jpg", "uri": "\/textbooks\/managerial-accounting-an-introduction-to-concepts-methods-and-uses-10th-edition-137", "see_more_uri": "" }, "free_related_book": { "isbn": "0815374755", "uri": "\/textbooks\/democracy-corruption-and-the-politics-of-spirits-in-contemporary-indonesia-1st-edition-9780815374756-141570", "name": "Democracy Corruption And The Politics Of Spirits In Contemporary Indonesia", "edition": "1st Edition" }, "question_posted": "2024-06-10 01:36:45", "see_more_questions_link": "\/study-help\/questions\/business-marketing-2022-June-08", "step_by_step_answer": "The Answer is in the image, click to view ...", "students_also_viewed": [ { "url": "\/form-the-vector-products-b-x-c-and-b8242", "description": "Form the vector products B C and B C, where B = B, and use the results obtained to prove the identity sina cos B -D sin (a+ B) + }sin (a - ). .C B'", "stars": 3 }, { "url": "\/you-are-the-cio-of-a-company-facing-a-potential", "description": "You are the CIO of a company facing a potential class action lawsuit over damages caused by one of its products. There has been some discussion at work about the potential for senior managers to be...", "stars": 3 }, { "url": "\/study-help\/psychology\/tell-me-about-an-ethical-dilemma-you-have-encountered-in-1980738", "description": "Tell me about an ethical dilemma you have encountered in the past. How did you address it?*", "stars": 3 }, { "url": "\/linda-olsen-is-studying-for-the-next-accounting-midterm-examination", "description": "Linda Olsen is studying for the next accounting midterm examination. Summarize for Linda what she should know about management functions.", "stars": 3 }, { "url": "\/study-help\/questions\/identify-the-advantages-of-valuation-using-market-multiples-compared-to-9903467", "description": "Identify the advantages of valuation using market multiples compared to valuation using discounted cash flows or discounted residual operating income, and Identify the disadvantages of valuation...", "stars": 3 }, { "url": "\/study-help\/questions\/a-convergence-arbitrage-strategy-is-usually-considered-question-2-1-9565876", "description": "A Convergence Arbitrage strategy is usually considered Question 2 1 options: A low risk strategy A high risk strategy A moderate risk strategy", "stars": 3 }, { "url": "\/study-help\/questions\/read-the-topic-resource-document-retrieval-and-text-retrieval-to-999696", "description": "Read the topic Resource \"Document Retrieval and Text Retrieval\" to enhance your understanding of the process for document and text retrieval. Based on the article, explain how a document and text can...", "stars": 3 }, { "url": "\/study-help\/questions\/1-describe-the-main-purpose-of-demand-forecasting-2-explain-1006552", "description": "1. Describe the main purpose of demand forecasting. 2. Explain the different types of forecasting. 3. List out the steps involved in forecasting? 4. Discuss the time series analysis?", "stars": 3 }, { "url": "\/study-help\/questions\/1-review-existing-strategies-implemented-at-volvo-for-green-building-1005438", "description": "1. Review existing strategies implemented at Volvo for Green Building and Energy Technology. (1 point and explanation) 2. Share findings on adequacy, sufficiency, and appropriateness (1 point and...", "stars": 3 }, { "url": "\/study-help\/questions\/you-have-been-hired-as-a-restaurant-manager-for-a-1006606", "description": "You have been hired as a Restaurant Manager for a new restaurant in downtown Toronto. The owner, Mr. McDavid, has come to you with a request to incorporate sustainability within the business, both...", "stars": 3 }, { "url": "\/study-help\/questions\/1-discuss-the-seven-factors-that-should-be-addressed-when-1005190", "description": "1. Discuss the seven factors that should be addressed when making the business case for a new Information System. There are seven factors that should be addressed when making the business case for a...", "stars": 3 }, { "url": "\/study-help\/questions\/products-things-in-demand-at-various-facilities-at-my-organization-5050590", "description": "Products: things in demand at various facilities. At my organization, the product is oil and gas going through the pipeline. The demand would be the material to keep our tank farms and pipelines...", "stars": 3 }, { "url": "\/study-help\/introduction-to-emergency-management\/select-a-hazard-that-affects-you-or-your-community-describe-1551550", "description": "Select a hazard that affects you or your community. Describe the characteristics of the hazard (how it would affect you or the community, including strong winds, ground shaking, etc.). Assess the...", "stars": 3 }, { "url": "\/study-help\/introduction-to-emergency-management\/what-mitigation-measures-are-best-suited-to-address-the-hazards-1551547", "description": "What mitigation measures are best suited to address the hazards faced by your community?", "stars": 3 }, { "url": "\/study-help\/introduction-to-emergency-management\/do-you-feel-that-more-should-be-done-to-address-1551546", "description": "Do you feel that more should be done to address your community's hazards? If so, what could or should be done?", "stars": 3 } ], "next_back_navigation": { "previous": "\/study-help\/questions\/use-a-graphing-calculator-to-find-a-linear-regression-model-2552429", "next": "\/study-help\/questions\/hi-could-someone-please-help-me-thank-you-i-would-2552431" }, "breadcrumbs": [ { "name": "Study help", "link": "https:\/\/www.solutioninn.com\/study-help\/questions-and-answers" }, { "name": "Business", "link": "https:\/\/www.solutioninn.com\/study-help\/questions-and-answers\/business" }, { "name": "Finance", "link": "https:\/\/www.solutioninn.com\/study-help\/questions\/business-finance" }, { "name": "Questions: Should Marshall acquire Electro-Engineering, Inc. (EE)? What is the most important", "link": "https:\/\/www.solutioninn.com\/study-help\/questions\/questions-should-marshall-acquire-electroengineering-inc-ee-what-is-the-2552430" } ], "skill_details": { "skill_id": "13", "skill_name": "Finance", "parent_id": "1" } } "1" } }