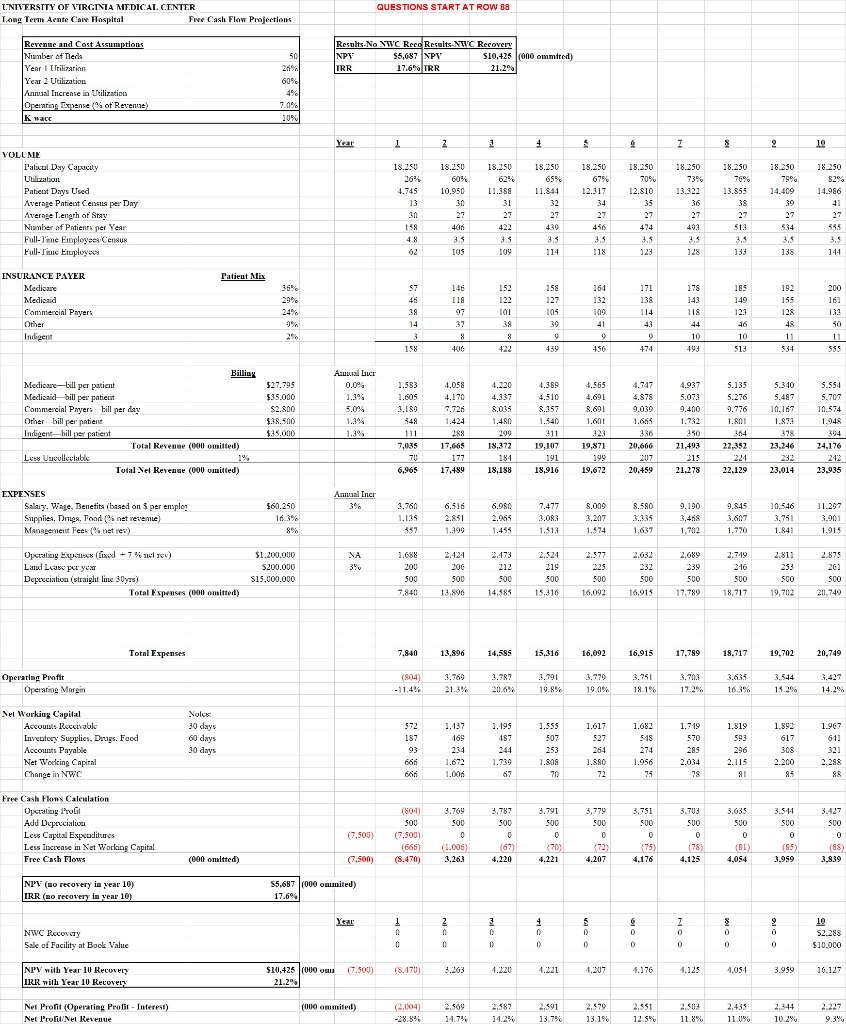
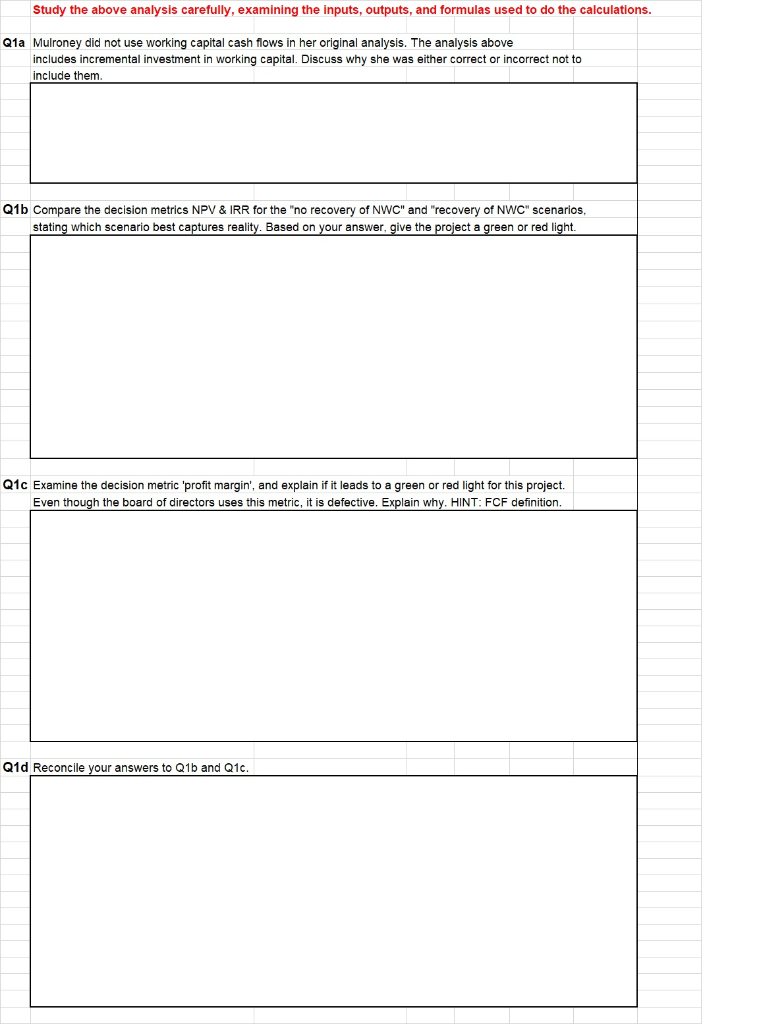
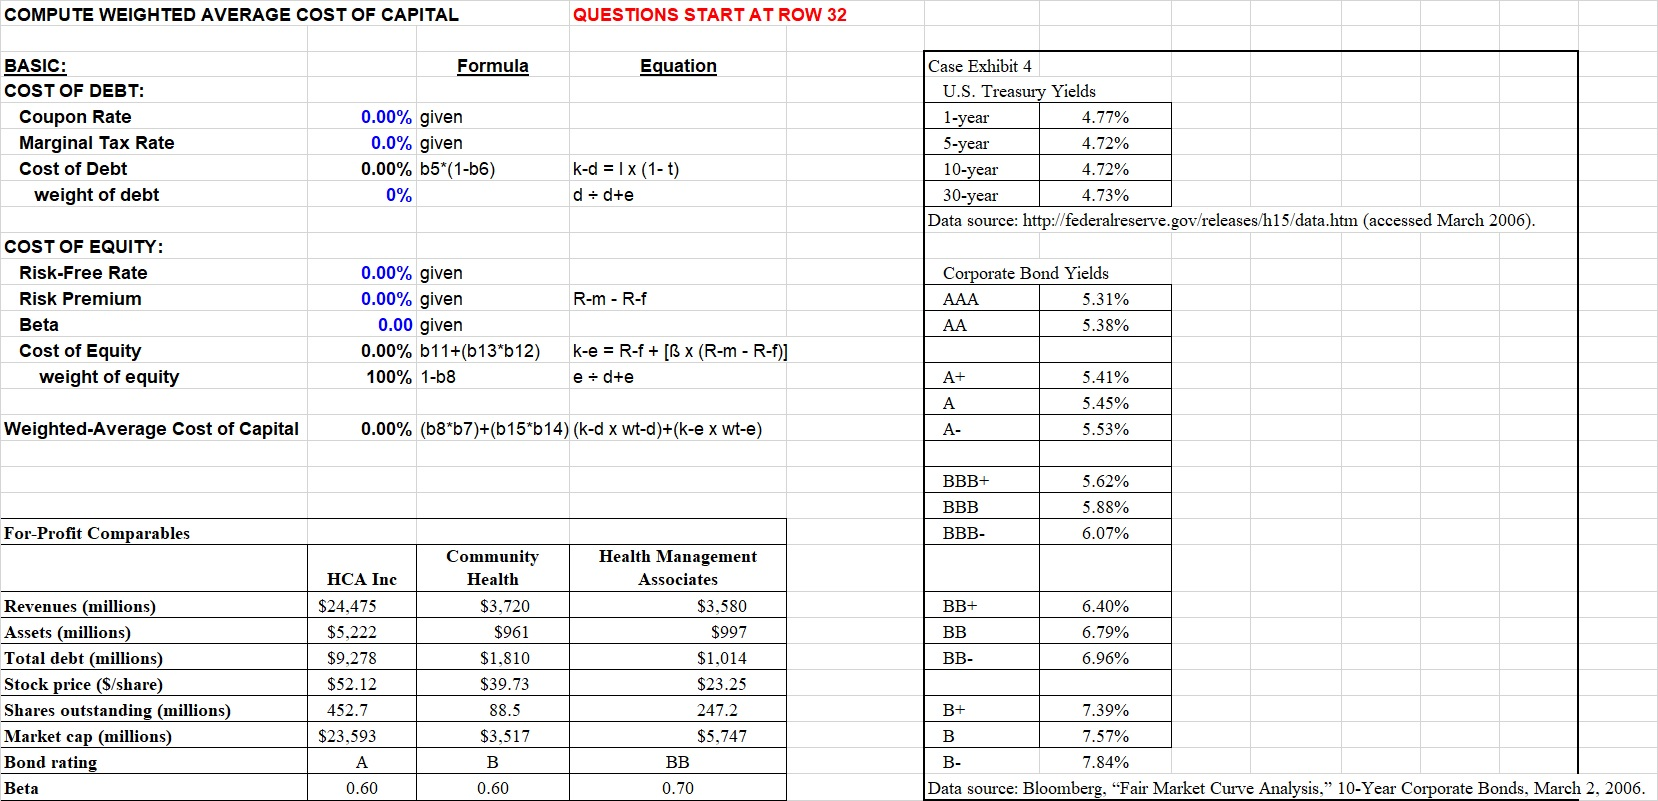
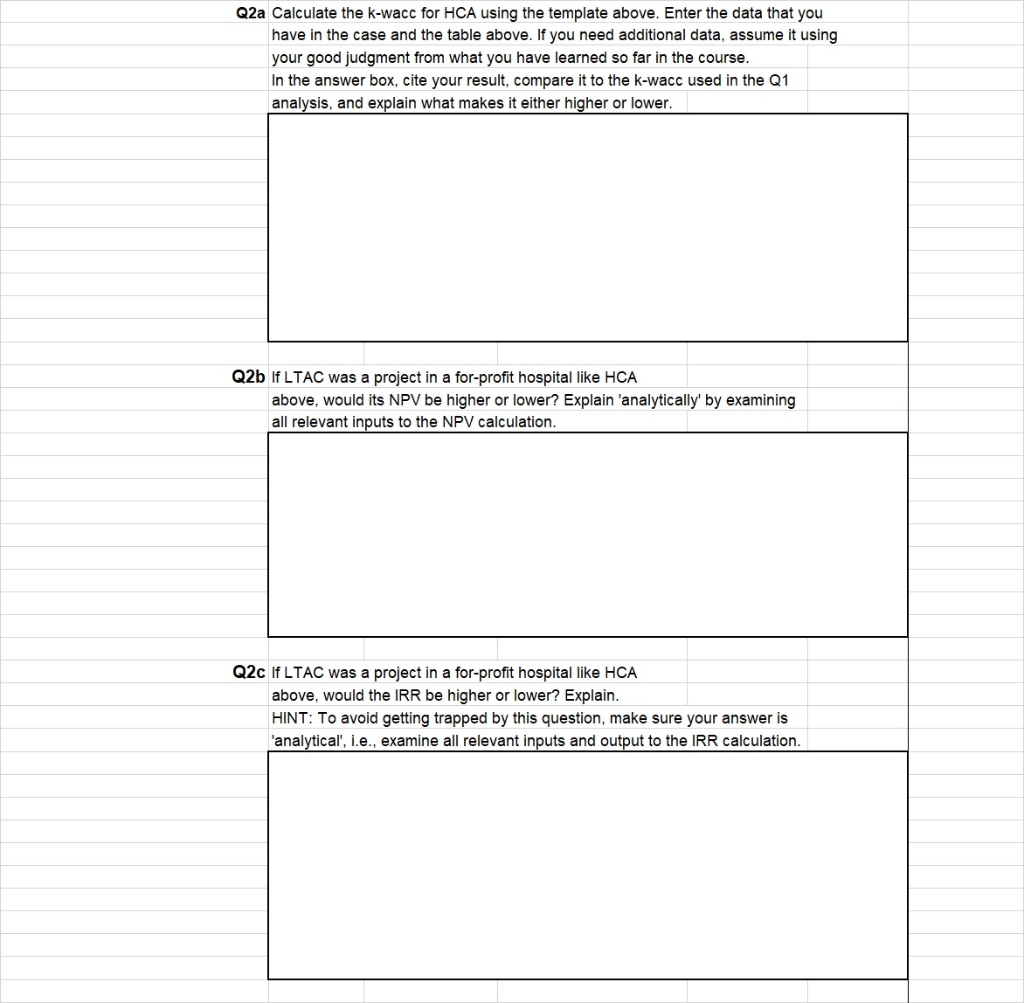
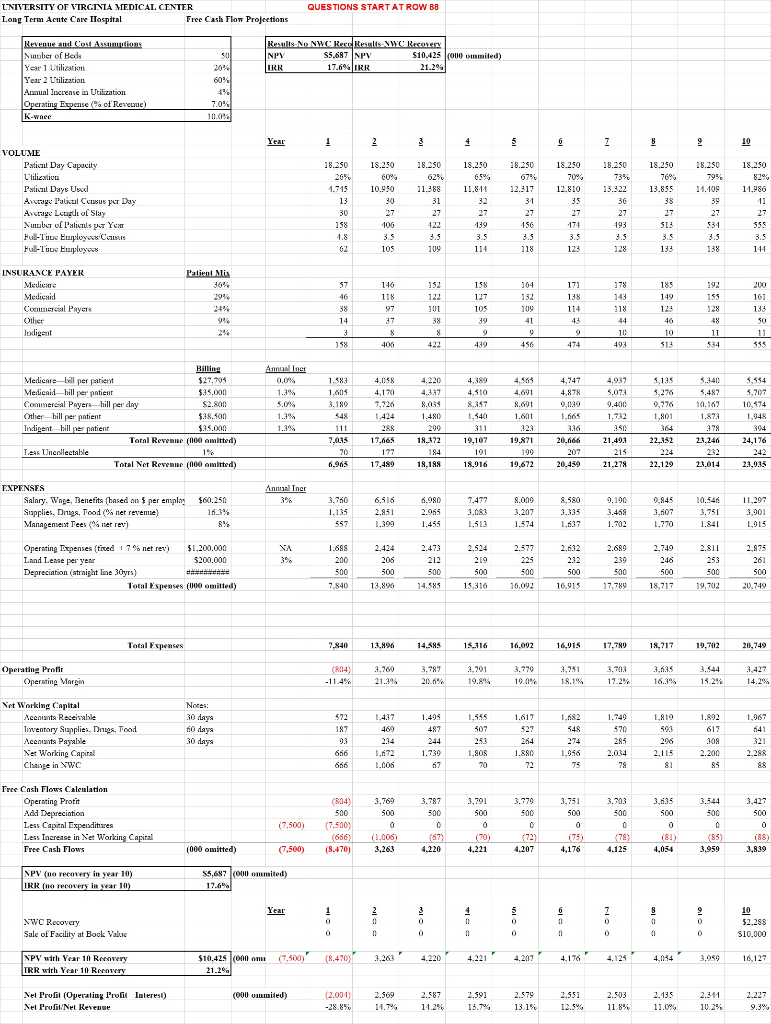
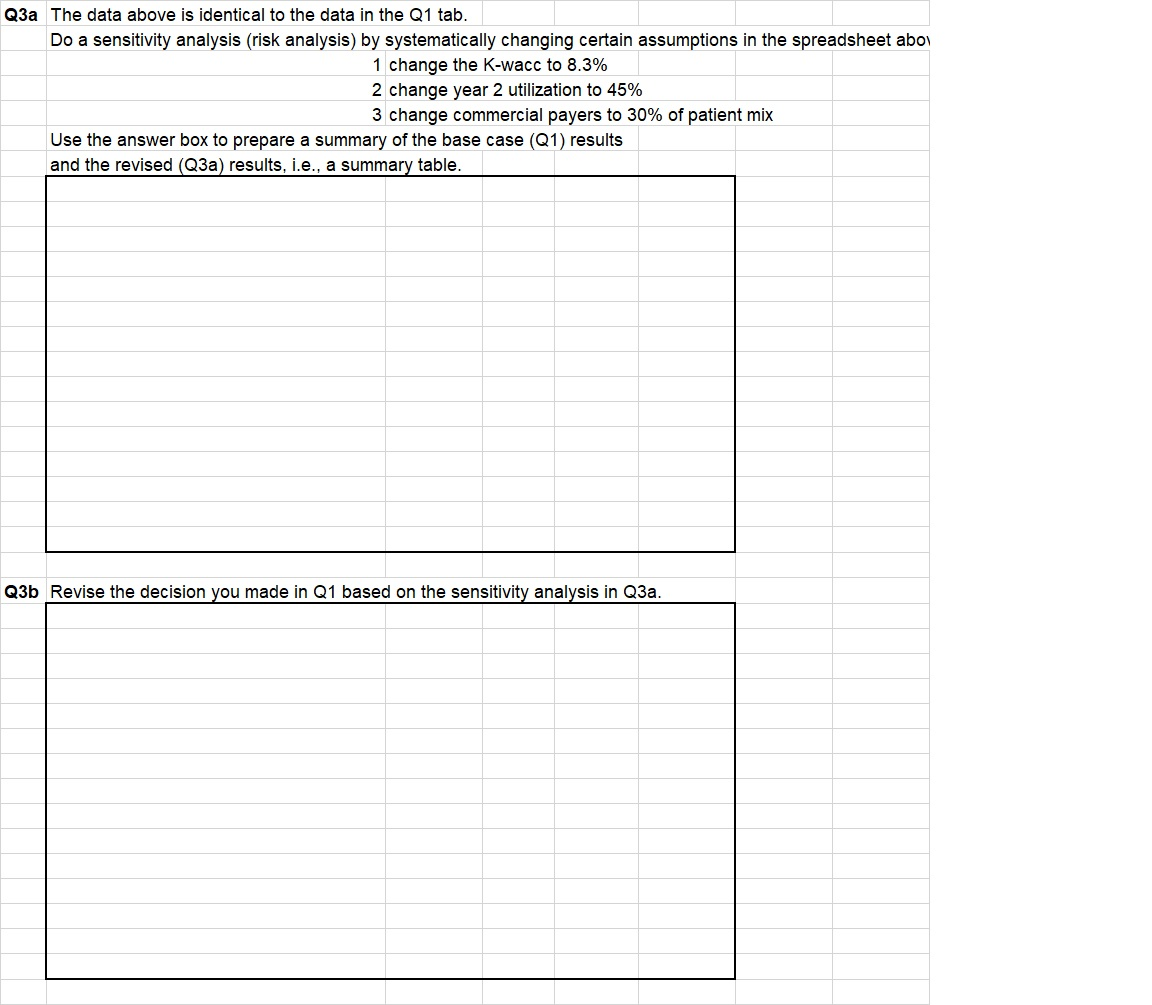
QUESTIONS START AT ROW 88 UNIVERSITY OF VIRGINIA MEDICAL CENTER Long Term Aente Care Hospital Fee Cash Flow Projections Results-No NWC Rece Results-NWC Recovery NPY $5,687 NPV $10,425 (000 ommtred) IRR 17.6% TRR 21.2% Revenue and Cost Assumptions Number of Teda Year 1 trilization Year 2 Utilization Annual Increase in Utilization Operating Expense % of Revenue) Kwa 7.0% 10% 9 10 18.250 18.250 60% 18.250 18.250 18.250 18.250 65% 11.844 18.250 67% 70% 73% 18.250 76% 13.855 18.250 79% 14.409 18.250 529 14.986 4.745 10.050 11.355 12117 12.810 13.322 VOLUME l'alocul Day Capacity Utilization Patient Days Used Average Patient Censis per Day Average Length of Stay Number of Patients per Year Full-Time Employees Census Full-I' Etuployees 406 456 474 403 513 $34 27 585 3.5 123 133 135 144 Patient Mix 36% 164 171 178 185 192 200 118 138 INSURANCE PAYER Medicare Medicaid Commercial Payers Other Indigent 161 109 114 118 30 10 158 406 10 493 439 474 513 534 Aqua Lucr 0.0% 4.565 1.583 1.605 4.058 4.170 7.726 4.937 5.073 4.691 $27.795 $35.000 S2 800 $.38.500 $35.000 4.220 4.337 8.035 1.480 4.510 8.357 Billing Medicare-bill per patient Medisad bill per patient Commercial Payers bill per day Other bill per patient Indigent bill per patient Total Revenue (000 omitted) Lees Uuwolkevlable Total Net Revenue (000 omitted) 4.878 9039 5.135 5.276 9.776 1.801 5.340 5.497 10.107 1.872 5,554 5.707 10.574 1.948 9.400 8.691 1.601 1.34 1.540 1.655 548 111 7,035 1.732 350 1. 288 290 378 3944 18.372 20.666 21,493 22.352 23.246 24,176 17.665 177 17.489 19.107 191 18.916 19.871 199 19.672 207 6,965 18,188 20.459 21.278 22.129 23.014 23,935 Annual Incr 560.250 3.009 8.580 9.190 9.845 10,546 EXPEYSES Salary, Wage, Benefits (based on 5 per emplo: Supplies. Dritos Tond (net revente) Management Fees (% net rev) 3.760 1.1.35 6.516 2.851 1.399 6.980 2.065 1.454 7.477 3.083 1.513 3.488 3.751 11.297 3.901 1.915 453 1.574 1.637 1.702 1.970 1.841 2.473 2.577 2.810 $1.200.000 $200.000 $15.000.000 2.632 232 2.875 262 206 219 216 Operating Expenses (fixed +7 % nel tev) LuLus per year Depecciation (straight line 30ys) Total Expenses (000 omitted) 255 200 500 7,840 500 500 500 500 13,806 500 18.717 14,585 15,316 16,002 16.915 97.789 19.702 20.749 Total Expenses 7.840 13.896 14.585 15.316 16.092 16,915 17.789 18,717 19,702 20,749 3.769 Operating Profit Operating Marin (804) -11.4% 3.787 20.6% 3.791 19.8% 3.779 19.0% 3.75 18.1% 3.003 17.2% 3.635 16.3% 3.544 15.2% 14.2% 572 ..137 1.195 1.682 1.749 1.967 Noles: 30 days 60 days 30 days 469 1.617 527 1.819 593 1.892 617 182 487 Nel Working Capital Accounts Receivable Inventory Supplies, Drugs. Food Accounts Payable Net Working Capital Change in NWC 570 93 1.555 507 253 1.808 70 264 308 2.200 665 1.739 1.956 2.034 1.672 1.005 2.288 1.880 72 2.115 81 3.791 3.635 3.769 SOU 3,787 300 3.779 500 Free Cash Flows Caleulation Opscaling rolit Add Depecialia Less Capital Expenditures Less Increase in Net Working Capital Free Cash Flows 3.751 500 3,703 SUO 3.544 SUO 500 500 500 (7.500) 800) SOV (7.500) (666) (8.470) (75) (67) 4.220 (1.006) 3.263 22) 4.207 (000 omitted) (70) 4.221 (7.500) (78) 4,125 (88) 3,839 4,176 (81) 4,054 (85) 3,959 NPV (no recovery in year 10) IRR (no recovery in year 10) $5,687 000 ommited) 17.6% Year NWC Recovery Sale of Facility at Bock Value 10 S2.288 $10,000 NPV with Year 10 Recovery RR with Year 10 Recovery 000 m (7.500) (8.470) 3.363 4.220 4.207 4.176 1.125 $10,425 21.2% 4.054 3.959 16.127 2.503 1000 ommited) Net Profit (Operating Profit - Interest) Nel Profil/Nel Revenue (2.004) -28.8% 2,569 14.7% 2.587 14.2% 2,435 2,591 13.7% 2,579 13.1% 2,551 12.5% 2,503 11.8% 2,344 11.0% views 10.2% 9.3% Study the above analysis carefully, examining the inputs, outputs, and formulas used to do the calculations. Q1a Mulroney did not use working capital cash flows in her original analysis. The analysis above includes incremental investment in working capital. Discuss why she was either correct or incorrect not to include them. Q1b Compare the decision metrics NPV & IRR for the "no recovery of NWC" and "recovery of NWC" scenarios, stating which scenario best captures reality. Based on your answer, give the project a green or red light. Q1c Examine the decision metric 'profit margin', and explain if it leads to a green or red light for this project. Even though the board of directors uses this metric, it is defective. Explain why. HINT: FCF definition. Q1d Reconcile your answers to Q1b and Q1c. COMPUTE WEIGHTED AVERAGE COST OF CAPITAL QUESTIONS START AT ROW 32 Formula Equation BASIC: COST OF DEBT: Coupon Rate Marginal Tax Rate Cost of Debt weight of debt 0.00% given 0.0% given 0.00% b5*(1-56) Case Exhibit 4 U.S. Treasury Yields 1-year 4.77% 5-year 4.72% 10-year 4.72% 30-year 4.73% Data source: http://federalreserve.gov/releases/h15/data.htm (accessed March 2006). k-d = 1 x (1-t) d-d+e 0% R-m - R-f COST OF EQUITY: Risk-Free Rate Risk Premium Beta Cost of Equity weight of equity 0.00% given 0.00% given 0.00 given 0.00% b11+(b13*b12) 100% 1-b8 Corporate Bond Yields AAA 5.31% 5.38% k-e = R-f + [B x (R-m - R-f)] e - d+e A+ A A- 5.41% 5.45% 5.53% Weighted Average Cost of Capital 0.00% (b8*b7)+(b15*b14) (k-d x wt-d)+(k-e x wt-e) BBB+ BBB BBB- 5.62% 5.88% 6.07% For-Profit Comparables BB+ BB BB- Revenues (millions) Assets (millions) Total debt (millions) Stock price ($/share) Shares outstanding (millions) Market cap (millions) Bond rating 6.40% 6.79% 6.96% Health Management Associates $3,580 $997 $1,014 $23.25 247.2 $5.747 BB HCA Inc $24,475 $5,222 $9.278 $52.12 452.7 $23,593 A 0.60 Community Health $3,720 $961 $1,810 $39.73 88.5 $3,517 B 0.60 B+ B 7.39% 7.57% 7.84% | Beta 0.70 Q2a Calculate the k-wacc for HCA using the template above. Enter the data that you have in the case and the table above. If you need additional data, assume it using your good judgment from what you have learned so far in the course. In the answer box, cite your result, compare it to the k-wacc used in the Q1 analysis, and explain what makes it either higher or lower. Q2b If LTAC was a project in a for-profit hospital like HCA above, would its NPV be higher or lower? Explain 'analytically' by examining all relevant inputs to the NPV calculation. Q2c If LTAC was a project in a for-profit hospital like HCA above, would the IRR be higher or lower? Explain. HINT: To avoid getting trapped by this question, make sure your answer is "analytical', i.e., examine all relevant inputs and output to the IRR calculation. QUESTIONS START AT ROW 88 UNIVERSITY OF VIRGINIA MEDICAL CENTER Long Term Acute Care Hospital Free Cash Flow Projections Results No NWC Race Rent WC Recovery NPV S5.687 NPV S10.425 Iron ommited) IRR 17.6% IRR 21.29 26% Revenue and cont A utions Nubber of Beds Year 1 Utilization Year 2 Utilization Annual Increase in Utilization Operating Expense % of Revenue) K-Waec 10.0 Year 18.250 18.250 18.250 18.250 18.250 18.250 18.250 18.250 26.250 67% 18.250 76% 13.855 799 1.715 70% 12.810 11.388 11.814 12.317 10.950 30 13.322 11.109 VOLUME Paticut Day Capacity L'tilization Patical Days Und Arway Palical Census par Day Away Lugu of Slay Nuobur of l'alimas psz Yuze Full-The Employce Cansus Full-The Employees 11.986 158 106 139 -156 555 15 3.5 -193 3.5 128 3.5 531 3.5 138 105 109 118 14 Patient Nis 146 52 17] 178 185 192 INSURANCE PAYER Medicure Medicaid Commercial Pryer Other lodigent 158 127 105 39 164 132 109 41 200 161 133 101 155 128 48 114 43 9 474 149 123 46 10 513 118 44 10 4 93 158 4 06 422 439 456 534 555 Annas Iner 0.0% 1.3% 5.0% Hillu Medicare il per patient $27.798 Medicaid bill per patient 35.000 Commercial Payers hill per day S2.800 Other hiller patient $38.500 Indigent hill patient Total Revenue (000 omitted) Tess Lincollectable Total Net Revenue (000 omitted) 1.583 1.605 3.180 548 4,058 4.170 7,726 1.424 4.220 4.337 8.035 1.480 4,389 4.510 8,357 1,340 4.565 4.601 8.601 .601 4,747 4,878 2,039 1,065 4.937 5.073 9.400 1.732 5,135 3,276 2,776 1,801 5.340 5.487 10.167 1.873 3,354 5,707 10,574 1,048 1 304 7,035 24,176 17,665 177 17,489 18,372 184 18,188 19,107 101 18,916 19.871 100 19.672 20,666 207 20,459 21,493 213 2 1,278 22,152 224 22,129 23.246 232 23.014 6,965 23,935 Annual Iner EXPENSES Salary. Woge, Benefits (hased on per emplos Supplies, Diga. Tood (% net revente) Management Tees net rev) $60.250 3.750 1.135 557 6,516 2.851 1,399 2 6.980 .965 1.455 7,477 3,083 1.513 8.000 3.207 1.574 8.580 3,335 1.837 9.190 3.459 1.202 9,845 3,607 1,770 10.546 3.751 1.841 11,297 3,901 1,015 NA 2,524 2,632 2.749 2.811 2.875 2.577 225 2.689 239 261 Operating Expenses (fixed + 7% net rev) $1.200.000 Land Leme per year $200.000 Depreciation (strnight line 30yrs) Total Expenses ( U omitted) 1.688 200 500 7,840 500 500 500 16,915 500 20.749 13.896 14,585 15.316 16.092 17,789 18.717 19,702 Total Expenses 7,840 13,896 14,585 15,316 16,092 16,915 17,789 1 8,717 19,702 20,749 3 Operating Profit Operating Marin (814) -11.4% 3,769 21.3% 3.787 20.6% 3,791 19,8% .770 0 10. 3,751 8,1% 3.703 12 % 3,635 16.3% 3.544 13.2% 3,427 14.2% 1 572 1.749 1.967 Notes: 30 days 60 days 30 days 1.355 507 1,617 47 527 1.819 591 187 93 1,682 48 Net Working Capital Accounts Receivable Torventory Supplies, Dne, Food Accounts Payable Net Working Capital Change in NWC 541 1.437 1.494 460 487 214244 1.672 1.739 1.005 1.892 617 108 2.200 2.20 321 1.056 2.034 2.288 656 656 1,808 70 1,880 72 2.115 81 (804) 3,791 3,779 3.635 500 3.544 500 3.427 500 500 500 500 500 500 Tree Cash Flows Calculation Operating Profit Add Deprecintion Less Capital Expenditures Less Increase in Net Working Capital Free Cash Flows (7.500) (7.500) (666) (8.470) 67 (79) (1.006) 3,263 (70) 4,221 72) 4.207 (75) 4,176 (88) 3,839 (7.500) 1811 4,054 1000 omitted) 4.220 (95) 3.959 4.125 NPV (no recovery in year 10) IRR (no recovery in year 10) $5,687,000 ommited) 17.6% Year NWC Recovery Sale of Facility at Book Value 10 52.288 $10,000 NPV with Year 10 Recovery TRR with Year 10 Recovery $10.425 21.20 000 m (7,5001" (8.470) 3.263' 4.220' 4,221 4.207' 4,178' 4.123 4,054 3.959 16,127 lalerest) (000 united) Nel Profil (Operating roli Nel Profit Net Revenue (2.001) -28.8% 2.569 14.7% 2.587 11.2% 2.591 13.7% 2.579 13.1% 2.551 12.5% 2.803 11.8% 2.135 11.0% 2.31 0.2% 2.227 9.3% Q3a The data above is identical to the data in the Q1 tab. Do a sensitivity analysis (risk analysis) by systematically changing certain assumptions in the spreadsheet abov 1 change the K-wacc to 8.3% 2 change year 2 utilization to 45% 3 change commercial payers to 30% of patient mix Use the answer box to prepare a summary of the base case (Q1) results and the revised (Q3a) results, i.e., a summary table. Q3b Revise the decision you made in Q1 based on the sensitivity analysis in Q3a. QUESTIONS START AT ROW 88 UNIVERSITY OF VIRGINIA MEDICAL CENTER Long Term Aente Care Hospital Fee Cash Flow Projections Results-No NWC Rece Results-NWC Recovery NPY $5,687 NPV $10,425 (000 ommtred) IRR 17.6% TRR 21.2% Revenue and Cost Assumptions Number of Teda Year 1 trilization Year 2 Utilization Annual Increase in Utilization Operating Expense % of Revenue) Kwa 7.0% 10% 9 10 18.250 18.250 60% 18.250 18.250 18.250 18.250 65% 11.844 18.250 67% 70% 73% 18.250 76% 13.855 18.250 79% 14.409 18.250 529 14.986 4.745 10.050 11.355 12117 12.810 13.322 VOLUME l'alocul Day Capacity Utilization Patient Days Used Average Patient Censis per Day Average Length of Stay Number of Patients per Year Full-Time Employees Census Full-I' Etuployees 406 456 474 403 513 $34 27 585 3.5 123 133 135 144 Patient Mix 36% 164 171 178 185 192 200 118 138 INSURANCE PAYER Medicare Medicaid Commercial Payers Other Indigent 161 109 114 118 30 10 158 406 10 493 439 474 513 534 Aqua Lucr 0.0% 4.565 1.583 1.605 4.058 4.170 7.726 4.937 5.073 4.691 $27.795 $35.000 S2 800 $.38.500 $35.000 4.220 4.337 8.035 1.480 4.510 8.357 Billing Medicare-bill per patient Medisad bill per patient Commercial Payers bill per day Other bill per patient Indigent bill per patient Total Revenue (000 omitted) Lees Uuwolkevlable Total Net Revenue (000 omitted) 4.878 9039 5.135 5.276 9.776 1.801 5.340 5.497 10.107 1.872 5,554 5.707 10.574 1.948 9.400 8.691 1.601 1.34 1.540 1.655 548 111 7,035 1.732 350 1. 288 290 378 3944 18.372 20.666 21,493 22.352 23.246 24,176 17.665 177 17.489 19.107 191 18.916 19.871 199 19.672 207 6,965 18,188 20.459 21.278 22.129 23.014 23,935 Annual Incr 560.250 3.009 8.580 9.190 9.845 10,546 EXPEYSES Salary, Wage, Benefits (based on 5 per emplo: Supplies. Dritos Tond (net revente) Management Fees (% net rev) 3.760 1.1.35 6.516 2.851 1.399 6.980 2.065 1.454 7.477 3.083 1.513 3.488 3.751 11.297 3.901 1.915 453 1.574 1.637 1.702 1.970 1.841 2.473 2.577 2.810 $1.200.000 $200.000 $15.000.000 2.632 232 2.875 262 206 219 216 Operating Expenses (fixed +7 % nel tev) LuLus per year Depecciation (straight line 30ys) Total Expenses (000 omitted) 255 200 500 7,840 500 500 500 500 13,806 500 18.717 14,585 15,316 16,002 16.915 97.789 19.702 20.749 Total Expenses 7.840 13.896 14.585 15.316 16.092 16,915 17.789 18,717 19,702 20,749 3.769 Operating Profit Operating Marin (804) -11.4% 3.787 20.6% 3.791 19.8% 3.779 19.0% 3.75 18.1% 3.003 17.2% 3.635 16.3% 3.544 15.2% 14.2% 572 ..137 1.195 1.682 1.749 1.967 Noles: 30 days 60 days 30 days 469 1.617 527 1.819 593 1.892 617 182 487 Nel Working Capital Accounts Receivable Inventory Supplies, Drugs. Food Accounts Payable Net Working Capital Change in NWC 570 93 1.555 507 253 1.808 70 264 308 2.200 665 1.739 1.956 2.034 1.672 1.005 2.288 1.880 72 2.115 81 3.791 3.635 3.769 SOU 3,787 300 3.779 500 Free Cash Flows Caleulation Opscaling rolit Add Depecialia Less Capital Expenditures Less Increase in Net Working Capital Free Cash Flows 3.751 500 3,703 SUO 3.544 SUO 500 500 500 (7.500) 800) SOV (7.500) (666) (8.470) (75) (67) 4.220 (1.006) 3.263 22) 4.207 (000 omitted) (70) 4.221 (7.500) (78) 4,125 (88) 3,839 4,176 (81) 4,054 (85) 3,959 NPV (no recovery in year 10) IRR (no recovery in year 10) $5,687 000 ommited) 17.6% Year NWC Recovery Sale of Facility at Bock Value 10 S2.288 $10,000 NPV with Year 10 Recovery RR with Year 10 Recovery 000 m (7.500) (8.470) 3.363 4.220 4.207 4.176 1.125 $10,425 21.2% 4.054 3.959 16.127 2.503 1000 ommited) Net Profit (Operating Profit - Interest) Nel Profil/Nel Revenue (2.004) -28.8% 2,569 14.7% 2.587 14.2% 2,435 2,591 13.7% 2,579 13.1% 2,551 12.5% 2,503 11.8% 2,344 11.0% views 10.2% 9.3% Study the above analysis carefully, examining the inputs, outputs, and formulas used to do the calculations. Q1a Mulroney did not use working capital cash flows in her original analysis. The analysis above includes incremental investment in working capital. Discuss why she was either correct or incorrect not to include them. Q1b Compare the decision metrics NPV & IRR for the "no recovery of NWC" and "recovery of NWC" scenarios, stating which scenario best captures reality. Based on your answer, give the project a green or red light. Q1c Examine the decision metric 'profit margin', and explain if it leads to a green or red light for this project. Even though the board of directors uses this metric, it is defective. Explain why. HINT: FCF definition. Q1d Reconcile your answers to Q1b and Q1c. COMPUTE WEIGHTED AVERAGE COST OF CAPITAL QUESTIONS START AT ROW 32 Formula Equation BASIC: COST OF DEBT: Coupon Rate Marginal Tax Rate Cost of Debt weight of debt 0.00% given 0.0% given 0.00% b5*(1-56) Case Exhibit 4 U.S. Treasury Yields 1-year 4.77% 5-year 4.72% 10-year 4.72% 30-year 4.73% Data source: http://federalreserve.gov/releases/h15/data.htm (accessed March 2006). k-d = 1 x (1-t) d-d+e 0% R-m - R-f COST OF EQUITY: Risk-Free Rate Risk Premium Beta Cost of Equity weight of equity 0.00% given 0.00% given 0.00 given 0.00% b11+(b13*b12) 100% 1-b8 Corporate Bond Yields AAA 5.31% 5.38% k-e = R-f + [B x (R-m - R-f)] e - d+e A+ A A- 5.41% 5.45% 5.53% Weighted Average Cost of Capital 0.00% (b8*b7)+(b15*b14) (k-d x wt-d)+(k-e x wt-e) BBB+ BBB BBB- 5.62% 5.88% 6.07% For-Profit Comparables BB+ BB BB- Revenues (millions) Assets (millions) Total debt (millions) Stock price ($/share) Shares outstanding (millions) Market cap (millions) Bond rating 6.40% 6.79% 6.96% Health Management Associates $3,580 $997 $1,014 $23.25 247.2 $5.747 BB HCA Inc $24,475 $5,222 $9.278 $52.12 452.7 $23,593 A 0.60 Community Health $3,720 $961 $1,810 $39.73 88.5 $3,517 B 0.60 B+ B 7.39% 7.57% 7.84% | Beta 0.70 Q2a Calculate the k-wacc for HCA using the template above. Enter the data that you have in the case and the table above. If you need additional data, assume it using your good judgment from what you have learned so far in the course. In the answer box, cite your result, compare it to the k-wacc used in the Q1 analysis, and explain what makes it either higher or lower. Q2b If LTAC was a project in a for-profit hospital like HCA above, would its NPV be higher or lower? Explain 'analytically' by examining all relevant inputs to the NPV calculation. Q2c If LTAC was a project in a for-profit hospital like HCA above, would the IRR be higher or lower? Explain. HINT: To avoid getting trapped by this question, make sure your answer is "analytical', i.e., examine all relevant inputs and output to the IRR calculation. QUESTIONS START AT ROW 88 UNIVERSITY OF VIRGINIA MEDICAL CENTER Long Term Acute Care Hospital Free Cash Flow Projections Results No NWC Race Rent WC Recovery NPV S5.687 NPV S10.425 Iron ommited) IRR 17.6% IRR 21.29 26% Revenue and cont A utions Nubber of Beds Year 1 Utilization Year 2 Utilization Annual Increase in Utilization Operating Expense % of Revenue) K-Waec 10.0 Year 18.250 18.250 18.250 18.250 18.250 18.250 18.250 18.250 26.250 67% 18.250 76% 13.855 799 1.715 70% 12.810 11.388 11.814 12.317 10.950 30 13.322 11.109 VOLUME Paticut Day Capacity L'tilization Patical Days Und Arway Palical Census par Day Away Lugu of Slay Nuobur of l'alimas psz Yuze Full-The Employce Cansus Full-The Employees 11.986 158 106 139 -156 555 15 3.5 -193 3.5 128 3.5 531 3.5 138 105 109 118 14 Patient Nis 146 52 17] 178 185 192 INSURANCE PAYER Medicure Medicaid Commercial Pryer Other lodigent 158 127 105 39 164 132 109 41 200 161 133 101 155 128 48 114 43 9 474 149 123 46 10 513 118 44 10 4 93 158 4 06 422 439 456 534 555 Annas Iner 0.0% 1.3% 5.0% Hillu Medicare il per patient $27.798 Medicaid bill per patient 35.000 Commercial Payers hill per day S2.800 Other hiller patient $38.500 Indigent hill patient Total Revenue (000 omitted) Tess Lincollectable Total Net Revenue (000 omitted) 1.583 1.605 3.180 548 4,058 4.170 7,726 1.424 4.220 4.337 8.035 1.480 4,389 4.510 8,357 1,340 4.565 4.601 8.601 .601 4,747 4,878 2,039 1,065 4.937 5.073 9.400 1.732 5,135 3,276 2,776 1,801 5.340 5.487 10.167 1.873 3,354 5,707 10,574 1,048 1 304 7,035 24,176 17,665 177 17,489 18,372 184 18,188 19,107 101 18,916 19.871 100 19.672 20,666 207 20,459 21,493 213 2 1,278 22,152 224 22,129 23.246 232 23.014 6,965 23,935 Annual Iner EXPENSES Salary. Woge, Benefits (hased on per emplos Supplies, Diga. Tood (% net revente) Management Tees net rev) $60.250 3.750 1.135 557 6,516 2.851 1,399 2 6.980 .965 1.455 7,477 3,083 1.513 8.000 3.207 1.574 8.580 3,335 1.837 9.190 3.459 1.202 9,845 3,607 1,770 10.546 3.751 1.841 11,297 3,901 1,015 NA 2,524 2,632 2.749 2.811 2.875 2.577 225 2.689 239 261 Operating Expenses (fixed + 7% net rev) $1.200.000 Land Leme per year $200.000 Depreciation (strnight line 30yrs) Total Expenses ( U omitted) 1.688 200 500 7,840 500 500 500 16,915 500 20.749 13.896 14,585 15.316 16.092 17,789 18.717 19,702 Total Expenses 7,840 13,896 14,585 15,316 16,092 16,915 17,789 1 8,717 19,702 20,749 3 Operating Profit Operating Marin (814) -11.4% 3,769 21.3% 3.787 20.6% 3,791 19,8% .770 0 10. 3,751 8,1% 3.703 12 % 3,635 16.3% 3.544 13.2% 3,427 14.2% 1 572 1.749 1.967 Notes: 30 days 60 days 30 days 1.355 507 1,617 47 527 1.819 591 187 93 1,682 48 Net Working Capital Accounts Receivable Torventory Supplies, Dne, Food Accounts Payable Net Working Capital Change in NWC 541 1.437 1.494 460 487 214244 1.672 1.739 1.005 1.892 617 108 2.200 2.20 321 1.056 2.034 2.288 656 656 1,808 70 1,880 72 2.115 81 (804) 3,791 3,779 3.635 500 3.544 500 3.427 500 500 500 500 500 500 Tree Cash Flows Calculation Operating Profit Add Deprecintion Less Capital Expenditures Less Increase in Net Working Capital Free Cash Flows (7.500) (7.500) (666) (8.470) 67 (79) (1.006) 3,263 (70) 4,221 72) 4.207 (75) 4,176 (88) 3,839 (7.500) 1811 4,054 1000 omitted) 4.220 (95) 3.959 4.125 NPV (no recovery in year 10) IRR (no recovery in year 10) $5,687,000 ommited) 17.6% Year NWC Recovery Sale of Facility at Book Value 10 52.288 $10,000 NPV with Year 10 Recovery TRR with Year 10 Recovery $10.425 21.20 000 m (7,5001" (8.470) 3.263' 4.220' 4,221 4.207' 4,178' 4.123 4,054 3.959 16,127 lalerest) (000 united) Nel Profil (Operating roli Nel Profit Net Revenue (2.001) -28.8% 2.569 14.7% 2.587 11.2% 2.591 13.7% 2.579 13.1% 2.551 12.5% 2.803 11.8% 2.135 11.0% 2.31 0.2% 2.227 9.3% Q3a The data above is identical to the data in the Q1 tab. Do a sensitivity analysis (risk analysis) by systematically changing certain assumptions in the spreadsheet abov 1 change the K-wacc to 8.3% 2 change year 2 utilization to 45% 3 change commercial payers to 30% of patient mix Use the answer box to prepare a summary of the base case (Q1) results and the revised (Q3a) results, i.e., a summary table. Q3b Revise the decision you made in Q1 based on the sensitivity analysis in Q3a


