Answered step by step
Verified Expert Solution
Question
1 Approved Answer
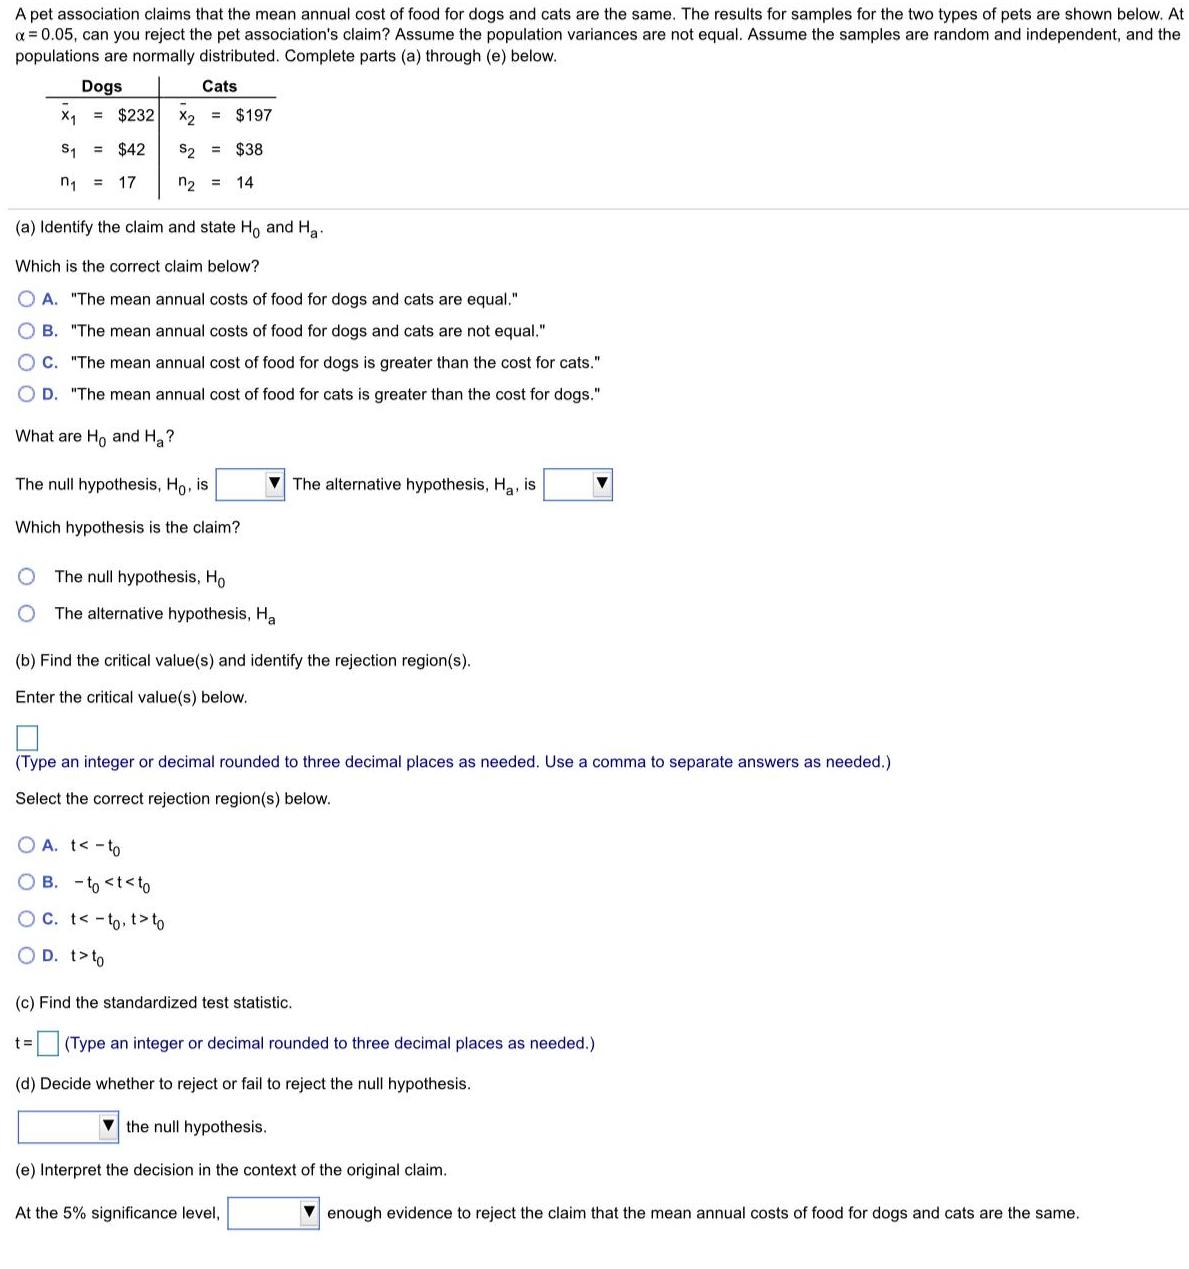
A pet association claims that the mean annual cost of food for dogs and cats are the same. The results for samples for the

A pet association claims that the mean annual cost of food for dogs and cats are the same. The results for samples for the two types of pets are shown below. At a = 0.05, can you reject the pet association's claim? Assume the population variances are not equal. Assume the samples are random and independent, and the populations are normally distributed. Complete parts (a) through (e) below. Dogs Cats X1 $232 X2 = $197 S1 = $42 S2 $38 %3D 17 n2 = 14 (a) Identify the claim and state Ho and Ha. Which is the correct claim below? A. "The mean annual costs of food for dogs and cats are equal." B. "The mean annual costs of food for dogs and cats are not equal." C. "The mean annual cost of food for dogs is greater than the cost for cats." O D. "The mean annual cost of food for cats is greater than the cost for dogs." What are Ho and H,? The null hypothesis, Ho, is V The alternative hypothesis, Ha, is Which hypothesis is the claim? The null hypothesis, Ho The alternative hypothesis, Ha (b) Find the critical value(s) and identify the rejection region(s). Enter the critical value(s) below. (Type an integer or decimal rounded to three decimal places as needed. Use a comma to separate answers as needed.) Select the correct rejection region(s) below. O A. t < - to O B. - to to O D. t> to (c) Find the standardized test statistic. t = (Type an integer or decimal rounded to three decimal places as needed.) (d) Decide whether to reject or fail to reject the null hypothesis. V the null hypothesis. (e) Interpret the decision in the context of the original claim. At the 5% significance level, V enough evidence to reject the claim that the mean annual costs of food for dogs and cats are the same.
Step by Step Solution
★★★★★
3.33 Rating (165 Votes )
There are 3 Steps involved in it
Step: 1

Get Instant Access to Expert-Tailored Solutions
See step-by-step solutions with expert insights and AI powered tools for academic success
Step: 2

Step: 3

Ace Your Homework with AI
Get the answers you need in no time with our AI-driven, step-by-step assistance
Get Started


