ququestion
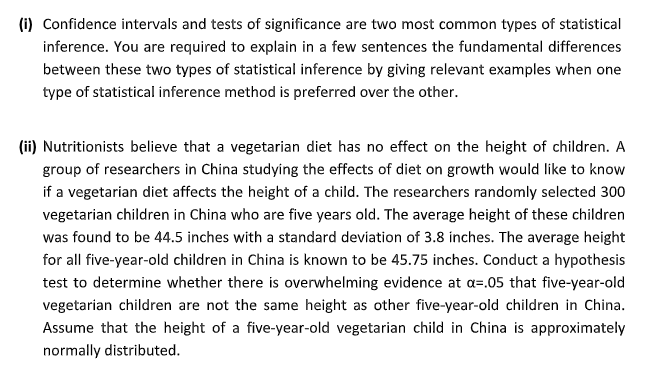
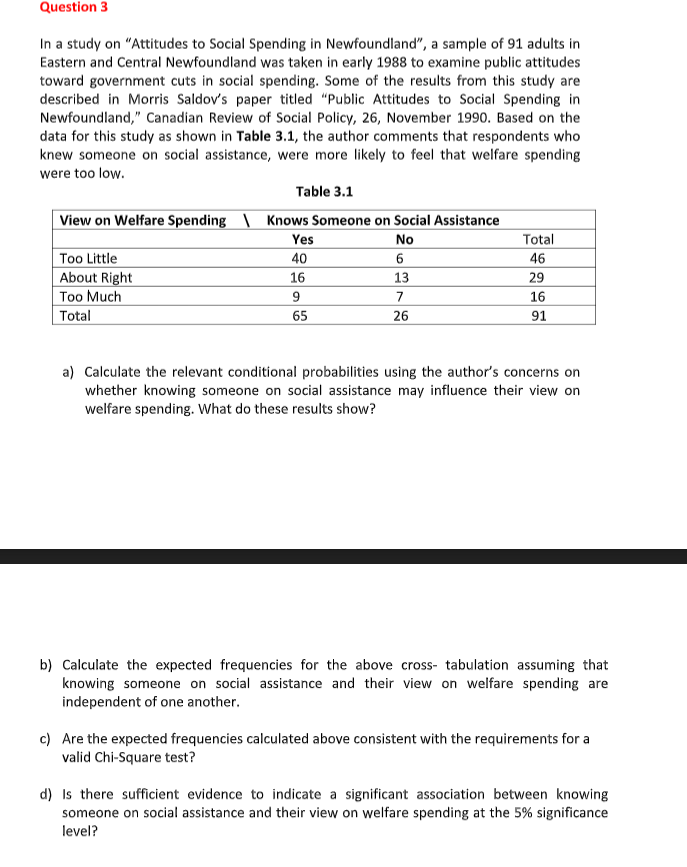
(1) Confidence intervals and tests of significance are two most common types of statistical inference. You are required to explain in a few sentences the fundamental differences between these two types of statistical inference by giving relevant examples when one type of statistical inference method is preferred over the other. (ii) Nutritionists believe that a vegetarian diet has no effect on the height of children. A group of researchers in China studying the effects of diet on growth would like to know if a vegetarian diet affects the height of a child. The researchers randomly selected 300 vegetarian children in China who are five years old. The average height of these children was found to be 44.5 inches with a standard deviation of 3.8 inches. The average height for all five-year-old children in China is known to be 45.75 inches. Conduct a hypothesis test to determine whether there is overwhelming evidence at a=.05 that five-year-old vegetarian children are not the same height as other five-year-old children in China. Assume that the height of a five-year-old vegetarian child in China is approximately normally distributed.Question 3 In a study on "Attitudes to Social Spending in Newfoundland", a sample of 91 adults in Eastern and Central Newfoundland was taken in early 1988 to examine public attitudes toward government cuts in social spending. Some of the results from this study are described in Morris Saldov's paper titled "Public Attitudes to Social Spending in Newfoundland," Canadian Review of Social Policy, 26, November 1990. Based on the data for this study as shown in Table 3.1, the author comments that respondents who knew someone on social assistance, were more likely to feel that welfare spending were too low. Table 3.1 View on Welfare Spending \\ Knows Someone on Social Assistance Yes No Total Too Little 40 6 46 About Right 16 13 29 Too Much 9 7 16 Total 65 26 91 a) Calculate the relevant conditional probabilities using the author's concerns on whether knowing someone on social assistance may influence their view on welfare spending. What do these results show? b) Calculate the expected frequencies for the above cross- tabulation assuming that knowing someone on social assistance and their view on welfare spending are independent of one another. c) Are the expected frequencies calculated above consistent with the requirements for a valid Chi-Square test? d) Is there sufficient evidence to indicate a significant association between knowing someone on social assistance and their view on welfare spending at the 5% significance level