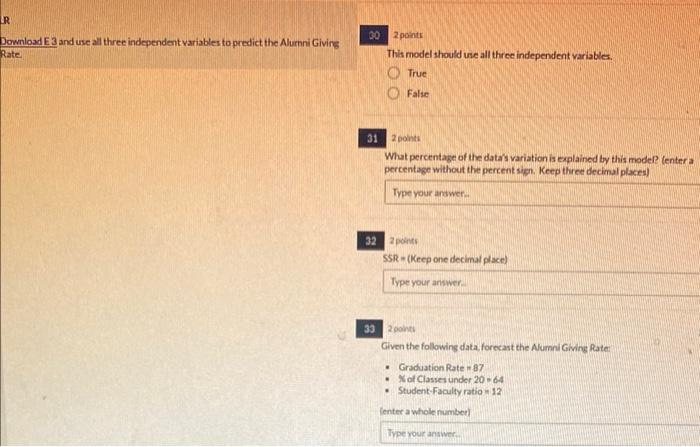
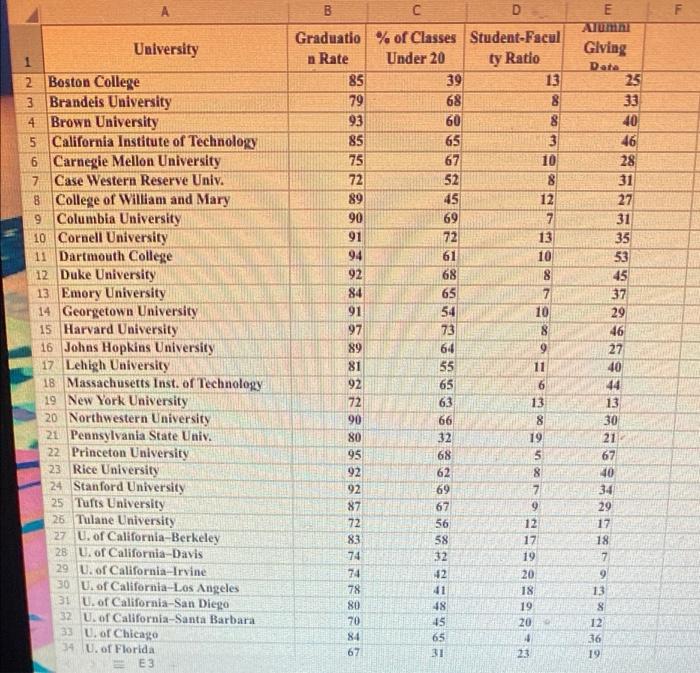
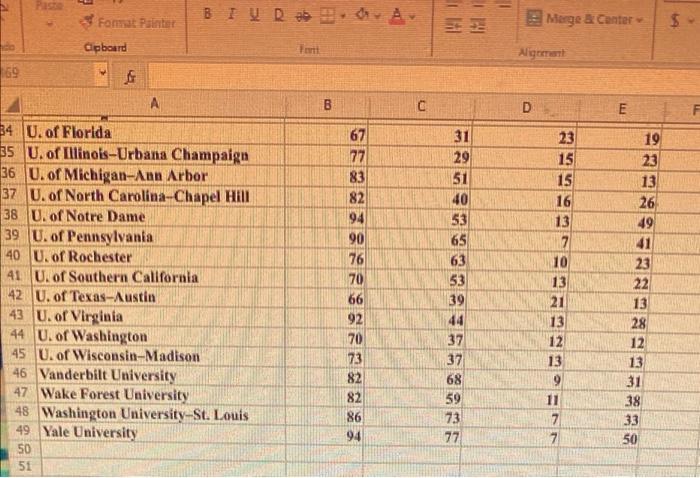
R Download E3 and use all three independent variables to predict the Alunni Giving Rate 30 points This model should use all three independent variables, True False 31 2 points What percentage of the data's variation is explained by this model tentera percentage without the percent sien. Keep three decimal places) Type your answer 32 points SSR(Keep one decimal place) Type your answer 332 Given the following data, forecast the Alumni Giving Rate . Graduation Rate 87 Xof Classes under 20 - 64 Student Faculty ratio 12 lenter a whole number Type your answer E F ty Ratio University 1 2 Boston College 3 Brandeis University 4 Brown University 5 California Institute of Technology 6 Carnegie Mellon University 7 Case Western Reserve Univ. 8. College of William and Mary 9 Columbia University 10 Cornell University 11 Dartmouth College 12 Duke University 13 Emory University 14 Georgetown University 15 Harvard University 16 Johns Hopkins University 17 Lehigh University 18 Massachusetts Inst. of Technology 19 New York University 20 Northwestern University 21 Pennsylvania State Univ. 22 Princeton University 23 Rice University 24 Stanford University 25 Tufts University 26 Tulane University 27 U of California-Berkeley 28 U. of California-Davis 29 U. of California-Irvine 30 U. of California Los Angeles 31 U. of California-San Diego 32 U. of California-Santa Barbara 33 U. of Chicago 34 U. of Florida E3 B C D Graduatio % of Classes Student-Facul n Rate Under 20 85 39 13 79 68 8 93 60 8 85 65 3 75 67 10 72 52 8 89 45 12 90 69 7 91 72 13 94 61 10 92 68 8 84 65 7 91 54 10 97 73 89 64 9 81 55 11 92 65 6 72 63 13 90 66 8 80 32 19 95 68 5 92 62 8 92 69 7 87 67 9 72 56 12 83 58 74 32 19 74 12 20 78 41 18 80 48 19 70 15 20 84 65 67 31 23 Glving Date 25 33 40 46 28 31 27 31 35 53 45 37 29 46 27 40 44 13 30 21 67 40 34 29 17 18 7 17 9 13 8 12 36 19 BTV Rab 2.0 A = = Merge a Canter $ Format Painter Clipboard $ Alignment 69 A B C D E 23 15 15 16 13 34 U. of Florida 35 U. of Illinois-Urbana Champaign 36 U. of Michigan-Ann Arbor 37 U. of North Carolina-Chapel Hill 38 U. of Notre Dame 39 U. of Pennsylvania 40 U. of Rochester 41 U. of Southern California 42 U. of Texas-Austin 43 U. of Virginia 44 U. of Washington 45 U. of Wisconsin-Madison 46 Vanderbilt University 47 Wake Forest University 48 Washington University-St. Louis 49 Yale University 50 51 67 77 83 82 94 90 76 70 66 92 70 73 82 82 86 94 =====S 31 29 51 40 53 65 63 53 39 44 37 37 68 59 73 77 10 13 21 13 12 13 9 11 7 7 19 23 13 26 49 41 23 22 13 28 12 13 31 38 33 50 R Download E3 and use all three independent variables to predict the Alunni Giving Rate 30 points This model should use all three independent variables, True False 31 2 points What percentage of the data's variation is explained by this model tentera percentage without the percent sien. Keep three decimal places) Type your answer 32 points SSR(Keep one decimal place) Type your answer 332 Given the following data, forecast the Alumni Giving Rate . Graduation Rate 87 Xof Classes under 20 - 64 Student Faculty ratio 12 lenter a whole number Type your answer E F ty Ratio University 1 2 Boston College 3 Brandeis University 4 Brown University 5 California Institute of Technology 6 Carnegie Mellon University 7 Case Western Reserve Univ. 8. College of William and Mary 9 Columbia University 10 Cornell University 11 Dartmouth College 12 Duke University 13 Emory University 14 Georgetown University 15 Harvard University 16 Johns Hopkins University 17 Lehigh University 18 Massachusetts Inst. of Technology 19 New York University 20 Northwestern University 21 Pennsylvania State Univ. 22 Princeton University 23 Rice University 24 Stanford University 25 Tufts University 26 Tulane University 27 U of California-Berkeley 28 U. of California-Davis 29 U. of California-Irvine 30 U. of California Los Angeles 31 U. of California-San Diego 32 U. of California-Santa Barbara 33 U. of Chicago 34 U. of Florida E3 B C D Graduatio % of Classes Student-Facul n Rate Under 20 85 39 13 79 68 8 93 60 8 85 65 3 75 67 10 72 52 8 89 45 12 90 69 7 91 72 13 94 61 10 92 68 8 84 65 7 91 54 10 97 73 89 64 9 81 55 11 92 65 6 72 63 13 90 66 8 80 32 19 95 68 5 92 62 8 92 69 7 87 67 9 72 56 12 83 58 74 32 19 74 12 20 78 41 18 80 48 19 70 15 20 84 65 67 31 23 Glving Date 25 33 40 46 28 31 27 31 35 53 45 37 29 46 27 40 44 13 30 21 67 40 34 29 17 18 7 17 9 13 8 12 36 19 BTV Rab 2.0 A = = Merge a Canter $ Format Painter Clipboard $ Alignment 69 A B C D E 23 15 15 16 13 34 U. of Florida 35 U. of Illinois-Urbana Champaign 36 U. of Michigan-Ann Arbor 37 U. of North Carolina-Chapel Hill 38 U. of Notre Dame 39 U. of Pennsylvania 40 U. of Rochester 41 U. of Southern California 42 U. of Texas-Austin 43 U. of Virginia 44 U. of Washington 45 U. of Wisconsin-Madison 46 Vanderbilt University 47 Wake Forest University 48 Washington University-St. Louis 49 Yale University 50 51 67 77 83 82 94 90 76 70 66 92 70 73 82 82 86 94 =====S 31 29 51 40 53 65 63 53 39 44 37 37 68 59 73 77 10 13 21 13 12 13 9 11 7 7 19 23 13 26 49 41 23 22 13 28 12 13 31 38 33 50


