Question
** R is necessary for the remaining questions. The movie Moneyball is about how proper use of statistics in baseball (called sabermetrics) can bring unexpected
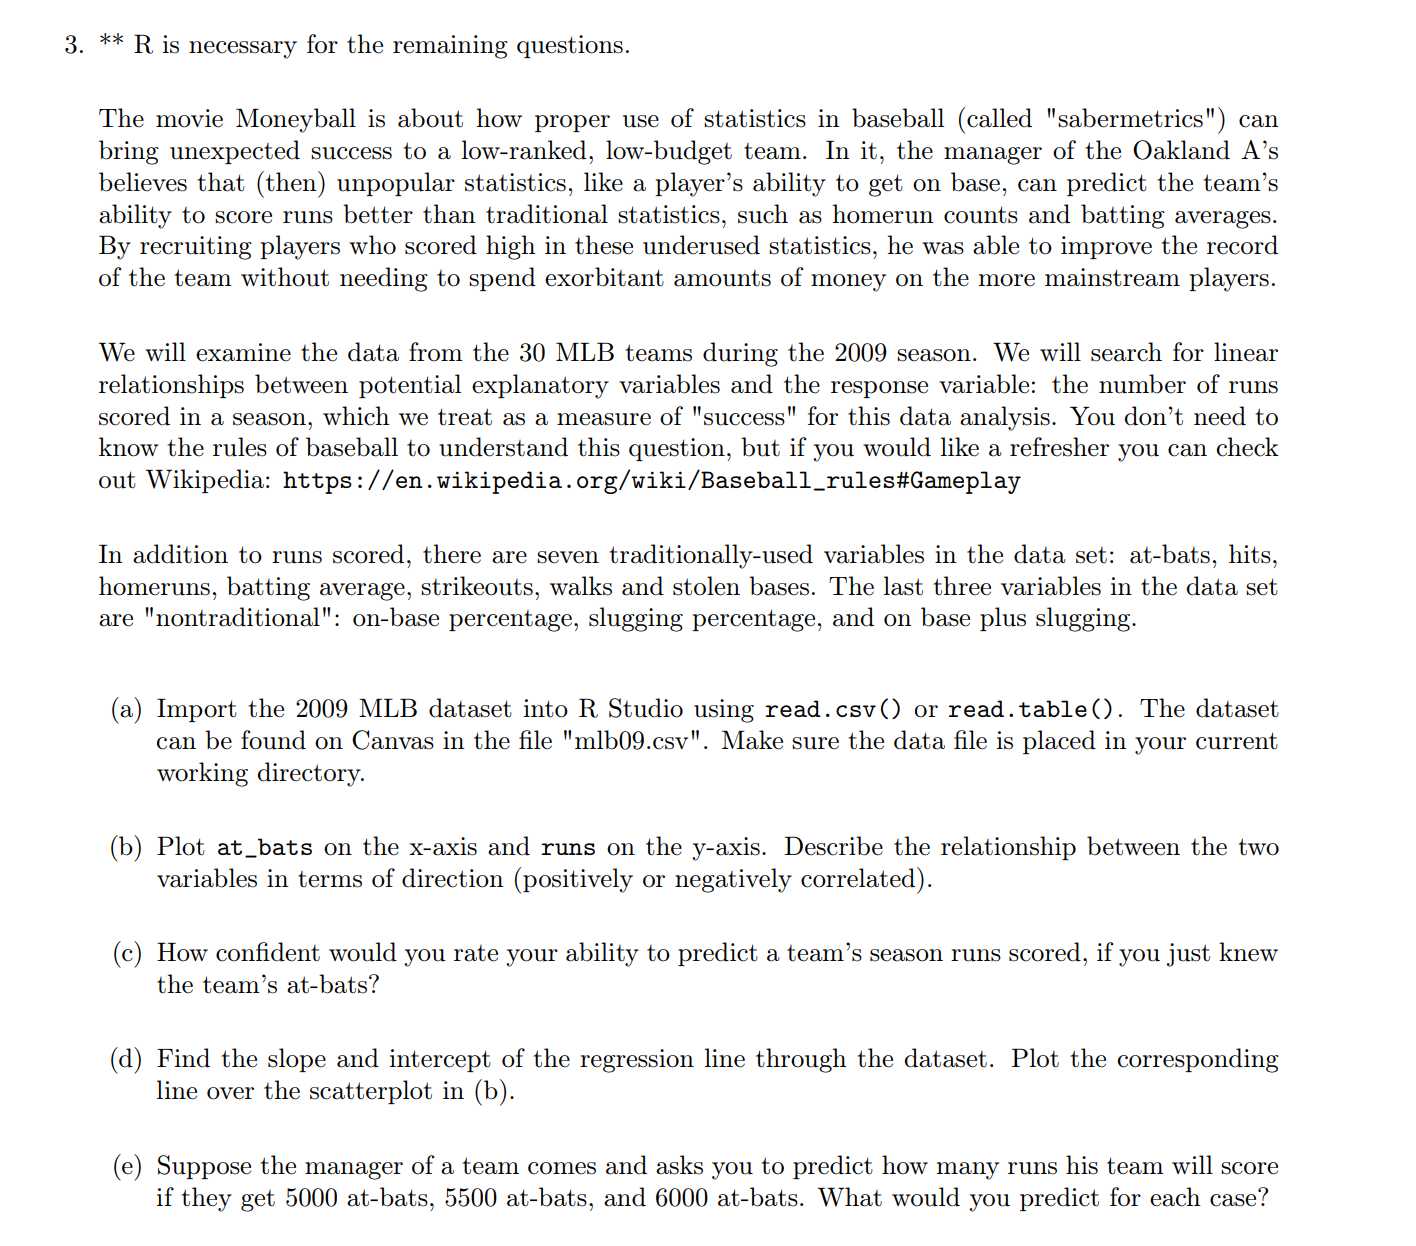
** R is necessary for the remaining questions. The movie Moneyball is about how proper use of statistics in baseball (called "sabermetrics") can bring unexpected success to a low-ranked, low-budget team. In it, the manager of the Oakland A's believes that (then) unpopular statistics, like a player's ability to get on base, can predict the team's ability to score runs better than traditional statistics, such as homerun counts and batting averages. By recruiting players who scored high in these underused statistics, he was able to improve the record of the team without needing to spend exorbitant amounts of money on the more mainstream players. We will examine the data from the 30 MLB teams during the 2009 season. We will search for linear relationships between potential explanatory variables and the response variable: the number of runs scored in a season, which we treat as a measure of "success" for this data analysis. You don't need to know the rules of baseball to understand this question, but if you would like a refresher you can check out Wikipedia: https://en.wikipedia.org/wiki/Baseball_rules#Gameplay In addition to runs scored, there are seven traditionally-used variables in the data set: at-bats, hits, homeruns, batting average, strikeouts, walks and stolen bases. The last three variables in the data set are "nontraditional": on-base percentage, slugging percentage, and on base plus slugging. (a) Import the 2009 MLB dataset into R Studio using read.csv() or read.table(). The dataset can be found on Canvas in the file "mlb09.csv". Make sure the data file is placed in your current working directory. (b) Plot at_bats on the x-axis and runs on the y-axis. Describe the relationship between the two variables in terms of direction (positively or negatively correlated). (c) How confident would you rate your ability to predict a team's season runs scored, if you just knew the team's at-bats? (d) Find the slope and intercept of the regression line through the dataset. Plot the corresponding line over the scatterplot in (b). (e) Suppose the manager of a team comes and asks you to predict how many runs his team will score if they get 5000 at-bats, 5500 at-bats, and 6000 at-bats. What would you predict for each case?

Step by Step Solution
There are 3 Steps involved in it
Step: 1

Get Instant Access to Expert-Tailored Solutions
See step-by-step solutions with expert insights and AI powered tools for academic success
Step: 2

Step: 3

Ace Your Homework with AI
Get the answers you need in no time with our AI-driven, step-by-step assistance
Get Started


