Answered step by step
Verified Expert Solution
Link Copied!

Question

1 Approved Answer

R-4.10 Explain why the plot of the function nc is a straight line with slope c on a log-log scale. C-4.12 Describe a method for
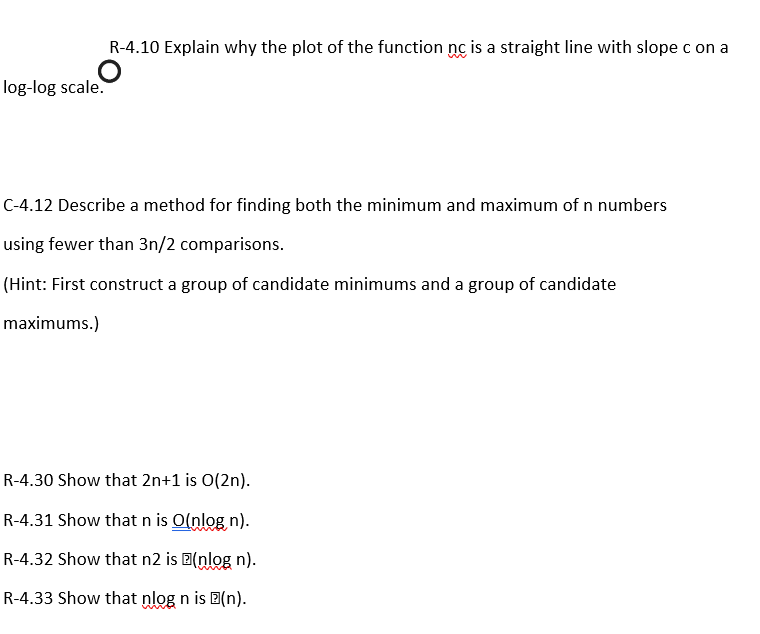
image text in transcribed

R-4.10 Explain why the plot of the function nc is a straight line with slope c on a log-log scale. C-4.12 Describe a method for finding both the minimum and maximum of n numbers using fewer than 3n/2 comparisons. (Hint: First construct a group of candidate minimums and a group of candidate maximums.) R-4.30 Show that 2n+1 is O(2n) R-4.31 Show that n is O(nlogn). R-4.32 Show that n2 is (nlog n). R-4.33 Show that nlog n is (n

Step by Step Solution

There are 3 Steps involved in it

Step: 1

blur-text-image

Get Instant Access to Expert-Tailored Solutions

See step-by-step solutions with expert insights and AI powered tools for academic success

Step: 2

blur-text-image

Step: 3

blur-text-image

Ace Your Homework with AI

Get the answers you need in no time with our AI-driven, step-by-step assistance

Get Started

Recommended Textbook for

Introduction To Data Mining

Authors: Pang Ning Tan, Michael Steinbach, Vipin Kumar

1st Edition

321321367, 978-0321321367

More Books

Students also viewed these Databases questions

Question

Calculate Cohens d^ for the data in Exercise 14.15.

Answered: 1 week ago

Question

Assessment of skills and interests.

Answered: 1 week ago

Question

Psychological, financial, and career counseling.

Answered: 1 week ago