Answered step by step
Verified Expert Solution
Question
1 Approved Answer
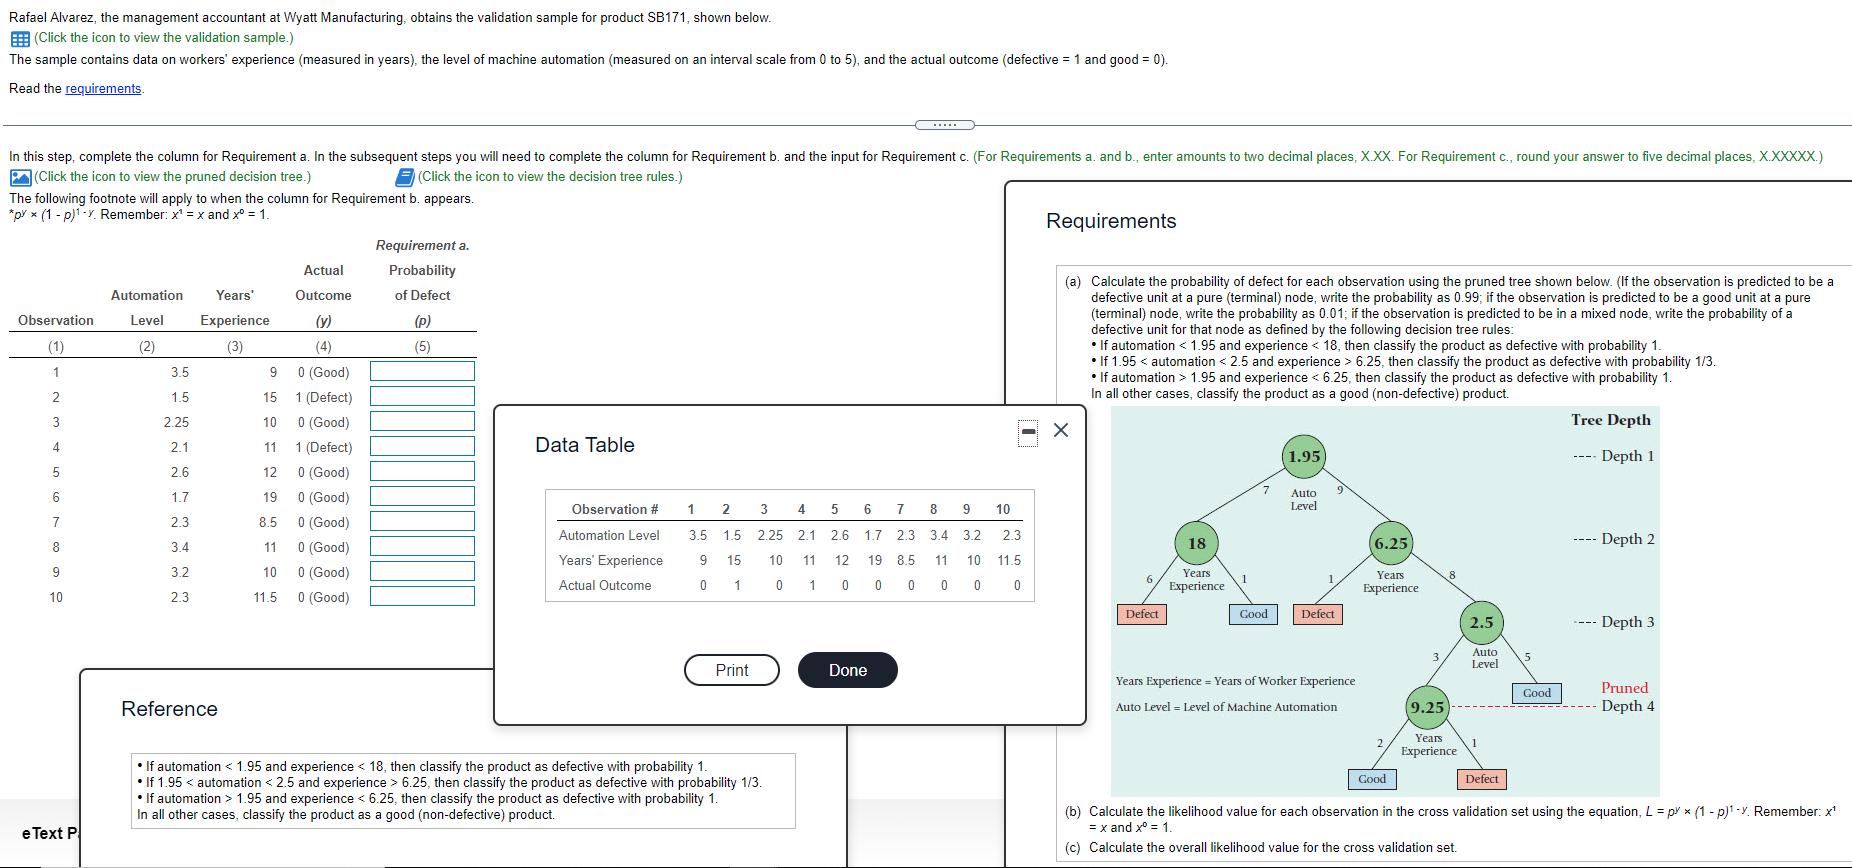
Rafael Alvarez, the management accountant at Wyatt Manufacturing, obtains the validation sample for product SB171, shown below. (Click the icon to view the validation

Rafael Alvarez, the management accountant at Wyatt Manufacturing, obtains the validation sample for product SB171, shown below. (Click the icon to view the validation sample.) The sample contains data on workers' experience (measured in years), the level of machine automation (measured on an interval scale from 0 to 5), and the actual outcome (defective = 1 and good = 0). Read the requirements. In this step, complete the column for Requirement a. In the subsequent steps you will need to complete the column for Requirement b. and the input for Requirement c. (For Requirements a. and b., enter amounts to two decimal places, X.XX. For Requirement c., round your answer to five decimal places, X.XXXXX.) (Click the icon to view the pruned decision tree.) (Click the icon to view the decision tree rules.) The following footnote will apply to when the column for Requirement b. appears. *pyx (1-p)-v. Remember: x = x and x = 1. Observation (1) 1 2 3 4 5 6 7 8 9 10 e Text P Automation Level (2) 3.5 1.5 2.25 2.1 2.6 1.7 2.3 3.4 3.2 2.3 Years' Experience (3) Reference 9 Actual Outcome (4) 0 (Good) 1 (Defect) 15 10 0 (Good) 11 1 (Defect) 12 0 (Good) 19 0 (Good) 8.5 0 (Good) 11 0 (Good) 10 0 (Good) 11.5 0 (Good) Requirement a. Probability of Defect (p) (5) Data Table Observation # Automation Level Years' Experience Actual Outcome 1 2 3.5 1.5 9 15 0 1 Print 3 4 2.25 2.1 10 11 0 1 If automation < 1.95 and experience < 18, then classify the product as defective with probability 1. If 1.95 < automation < 2.5 and experience > 6.25, then classify the product as defective with probability 1/3. If automation > 1.95 and experience < 6.25, then classify the product as defective with probability 1. In all other cases, classify the product as a good (non-defective) product. 5 2.6 12 0 6 7 1.7 2.3 19 8.5 0 0 Done 10 8 9 3.4 3.2 2.3 11 10 11.5 0 0 0 Requirements (a) Calculate the probability of defect for each observation using the pruned tree shown below. (If the observation is predicted to be a defective unit at a pure (terminal) node, write the probability as 0.99; if the observation is predicted to be a good unit at a pure (terminal) node, write the probability as 0.01; if the observation is predicted to be in a mixed node, write the probability of a defective unit for that node as defined by the following decision tree rules: If automation < 1.95 and experience 6.25, then classify the product as defective with probability 1/3. If automation > 1.95 and experience < 6.25, then classify the product as defective with probability 1. In all other cases, classify the product as a good (non-defective) product. -X 6 Defect 18 Years Experience Good (1.95) Auto Level 9 Defect Years Experience Years of Worker Experience Auto Level Level of Machine Automation 6.25 Years Experience Good (9.25 Years Experience 2.5 Auto Level 1 Defect 5 Good Tree Depth ---- Depth 1 ---- Depth 2 ---- Depth 3 Pruned Depth 4 (b) Calculate the likelihood value for each observation in the cross validation set using the equation, L = px x (1 - p)-y. Remember: x = x and x = 1 (c) Calculate the overall likelihood value for the cross validation set.
Step by Step Solution
★★★★★
3.38 Rating (154 Votes )
There are 3 Steps involved in it
Step: 1
Solving Requirement a Here the rule of thumb is 1 if Automation 195 and exp...
Get Instant Access to Expert-Tailored Solutions
See step-by-step solutions with expert insights and AI powered tools for academic success
Step: 2

Step: 3

Ace Your Homework with AI
Get the answers you need in no time with our AI-driven, step-by-step assistance
Get Started


