Answered step by step
Verified Expert Solution
Question
1 Approved Answer
Rank Category Frequency Cumulative Cumulative Frequency Percent Unable to schedule pre-op tests in evenings 296 296 31.0% Too noisy in unit 257 553 57.9% Inconvenient
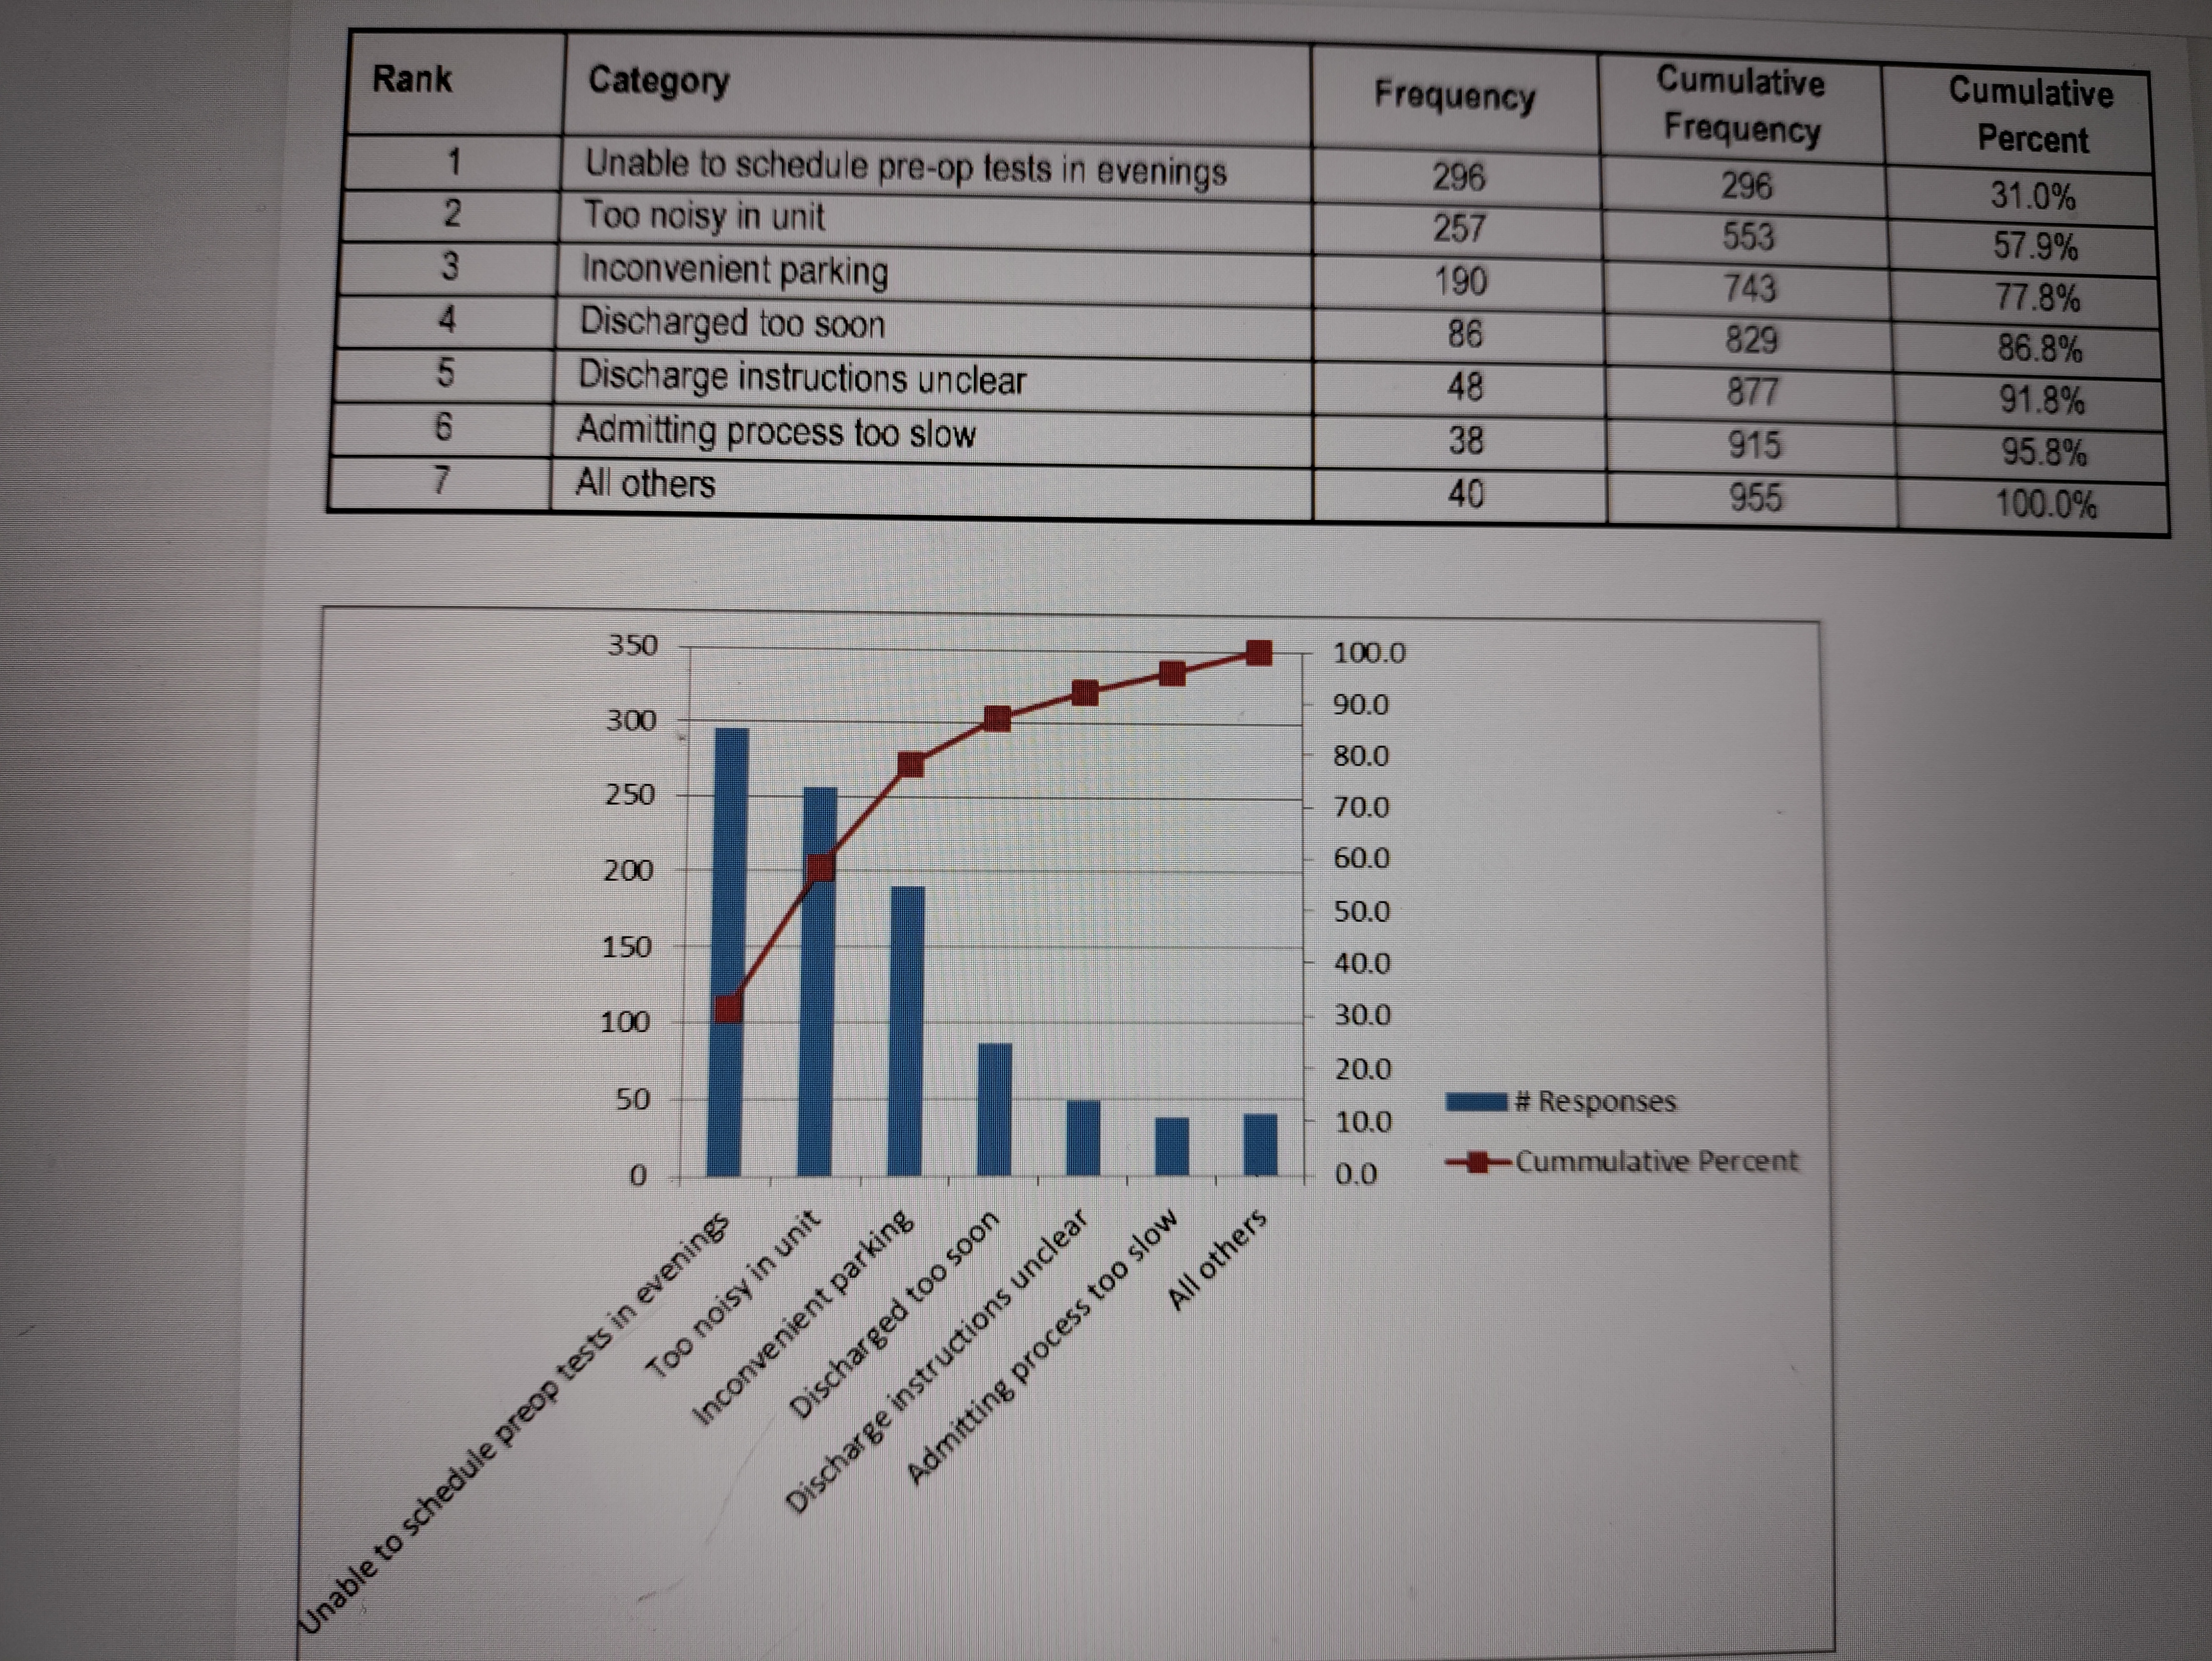
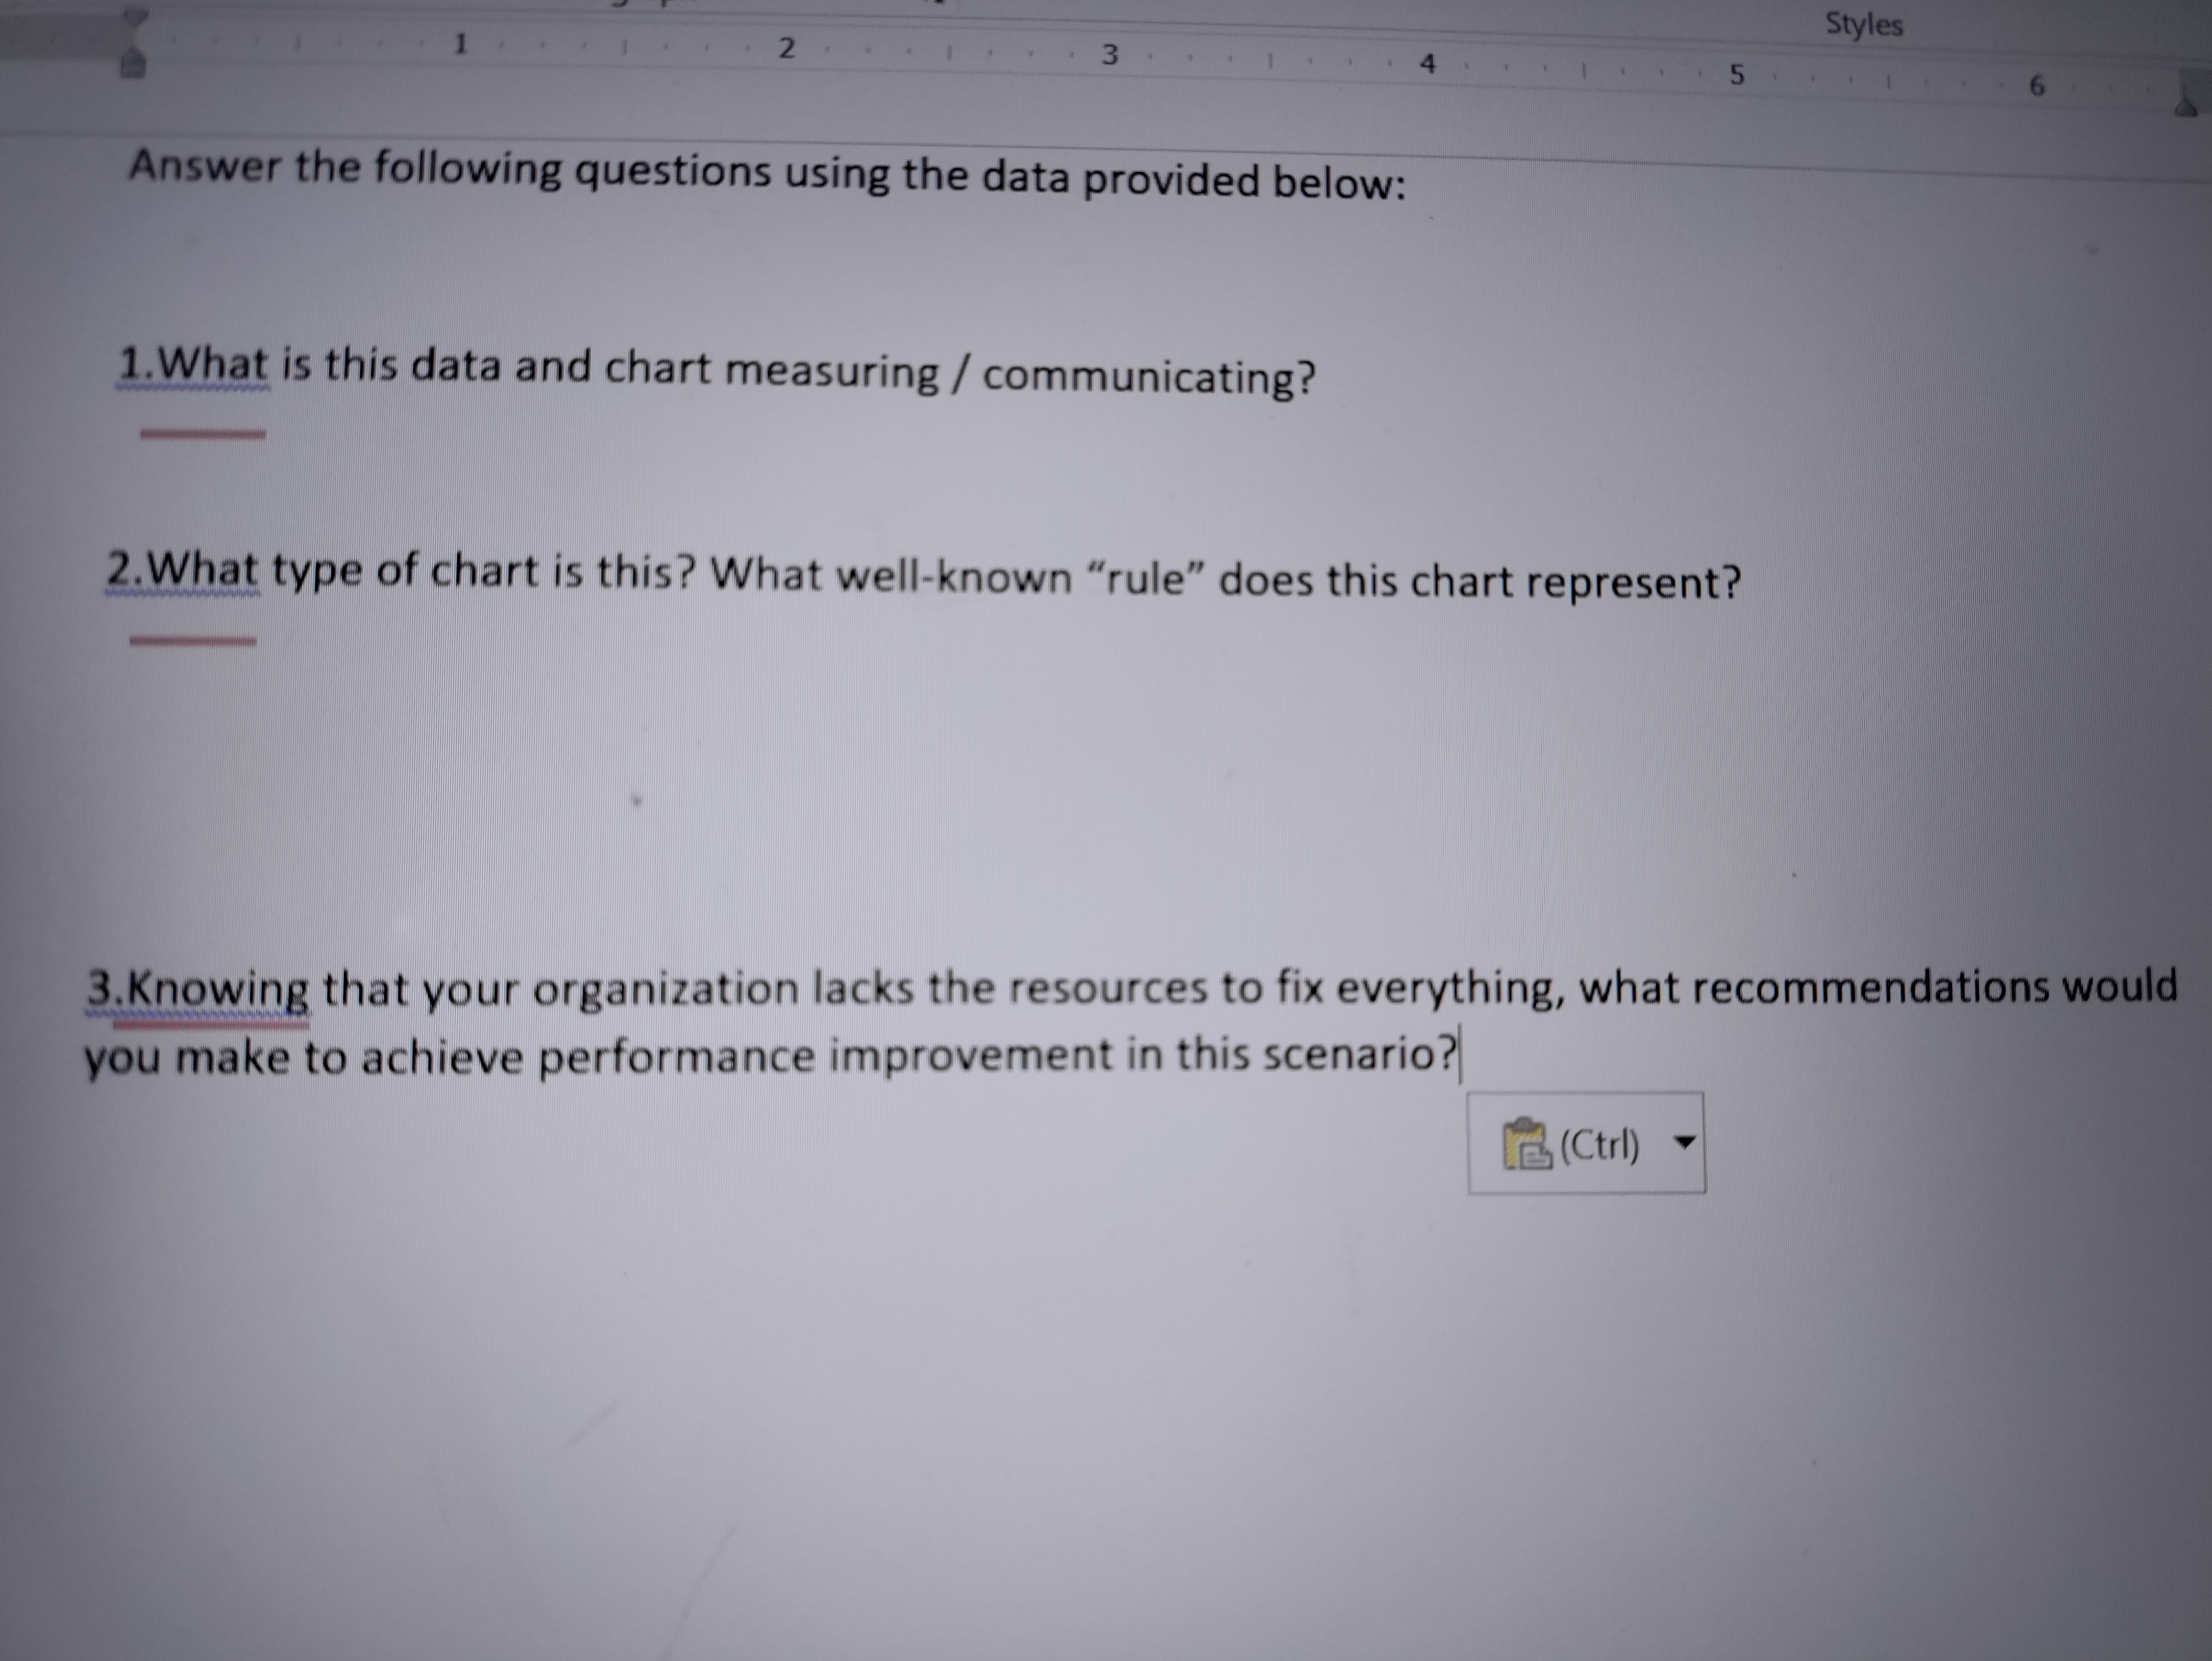
Rank Category Frequency Cumulative Cumulative Frequency Percent Unable to schedule pre-op tests in evenings 296 296 31.0% Too noisy in unit 257 553 57.9% Inconvenient parking 190 743 77.8% Discharged too soon 86 829 86.8% Discharge instructions unclear 48 877 91.8% Admitting process too slow 38 915 95.8% All others 40 955 100.0% 350 100.0 90.0 300 80.0 250 70.0 60.0 200 50.0 150 40.0 30.0 100 20.0 50 # Responses 10.0 0 0.0 -Cummulative Percent arking Don ther in e Too noisy in unit ests Inconvenient Discharged to Admitting process too slow Discharge instructions unclear Unable to schedule preop tStyles 5 Answer the following questions using the data provided below: 1. What is this data and chart measuring / communicating? 2. What type of chart is this? What well-known "rule" does this chart represent? 3.Knowing that your organization lacks the resources to fix everything, what recommendations would you make to achieve performance improvement in this scenario? (Ctrl)
Step by Step Solution
There are 3 Steps involved in it
Step: 1
Get Instant Access to Expert-Tailored Solutions
See step-by-step solutions with expert insights and AI powered tools for academic success
Step: 2
Step: 3
Ace Your Homework with AI
Get the answers you need in no time with our AI-driven, step-by-step assistance
Get Started