Answered step by step
Verified Expert Solution
Question
1 Approved Answer
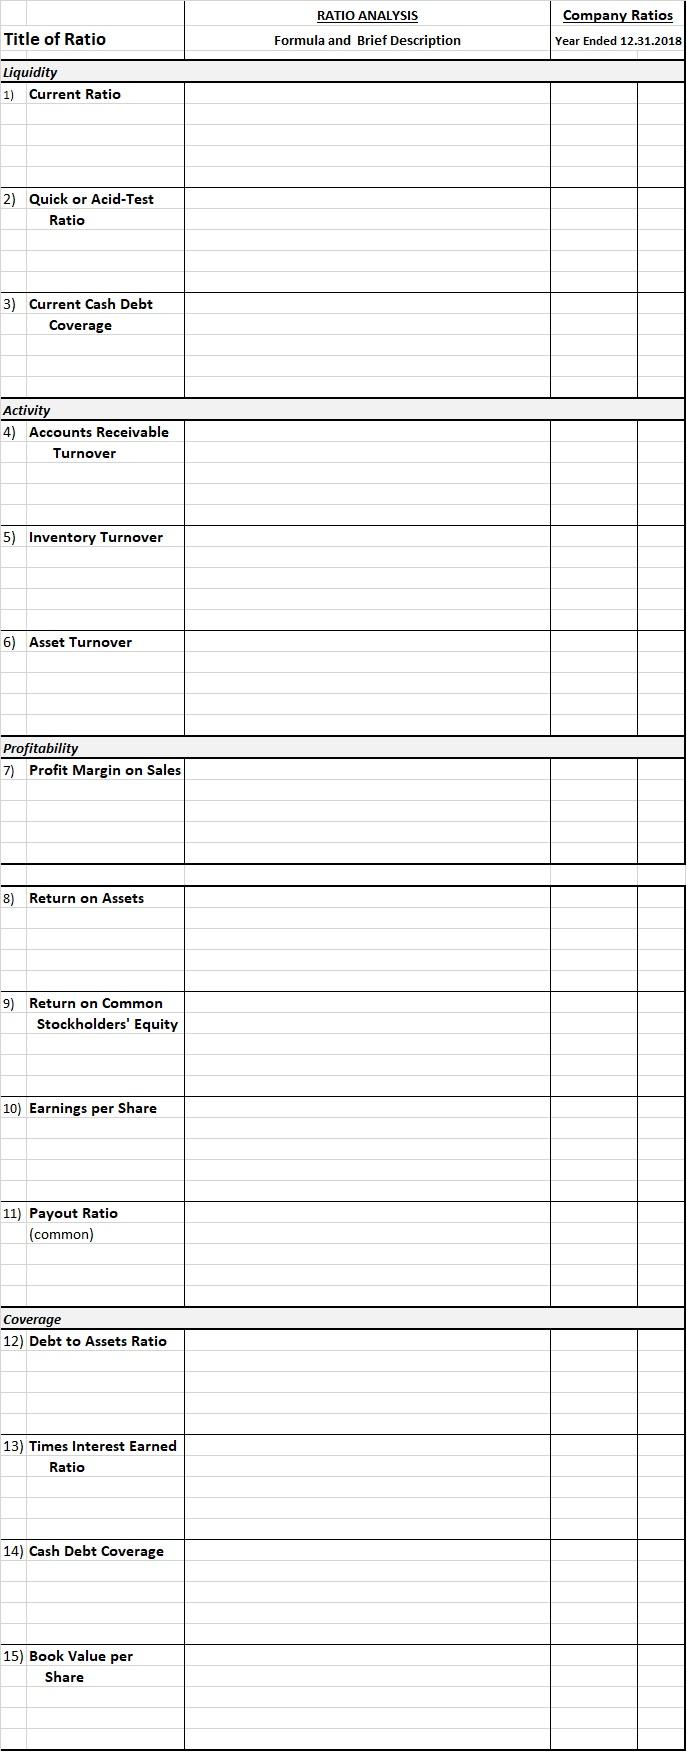
Ratio Analysis Find the ratios given below. You can use excel if you want to, just add the formula in the brief description box. Ryder
Ratio Analysis
Find the ratios given below. You can use excel if you want to, just add the formula in the brief description box.
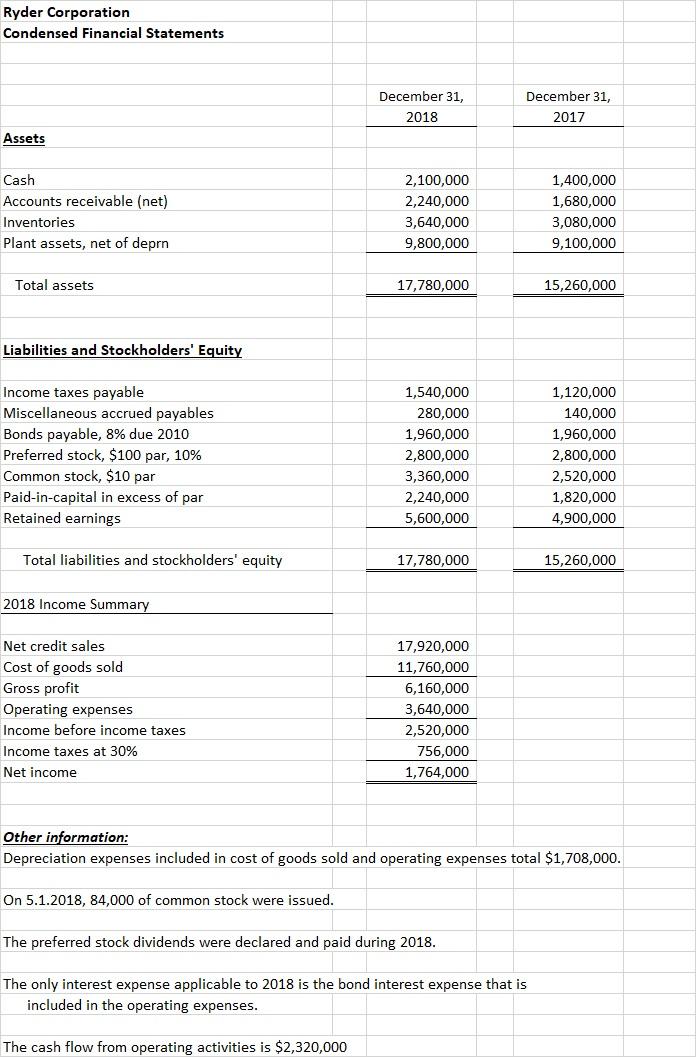
Ryder Corporation Condensed Financial Statements December 31, 2018 December 31, 2017 Assets Cash Accounts receivable (net) Inventories Plant assets, net of deprn 2,100,000 2,240,000 3,640,000 9,800,000 1,400,000 1,680,000 3,080,000 9,100,000 Total assets 17,780,000 15,260,000 Liabilities and Stockholders' Equity Income taxes payable Miscellaneous accrued payables Bonds payable, 8% due 2010 Preferred stock, $100 par, 10% Common stock, $10 par Paid-in-capital in excess of par Retained earnings 1,540,000 280,000 1,960,000 2,800,000 3,360,000 2,240,000 5,600,000 1,120,000 140,000 1,960,000 2,800,000 2,520,000 1,820,000 4,900,000 Total liabilities and stockholders' equity 17,780,000 15,260,000 2018 Income Summary Net credit sales Cost of goods sold Gross profit Operating expenses Income before income taxes Income taxes at 30% Net income 17,920,000 11,760,000 6,160,000 3,640,000 2,520,000 756,000 1,764,000 Other information: Depreciation expenses included in cost of goods sold and operating expenses total $1,708,000. On 5.1.2018, 84,000 of common stock were issued. The preferred stock dividends were declared and paid during 2018. The only interest expense applicable to 2018 is the bond interest expense that is included in the operating expenses. The cash flow from operating activities is $2,320,000 Company Ratios RATIO ANALYSIS Formula and Brief Description Title of Ratio Year Ended 12.31.2018 Liquidity 1) Current Ratio 2) Quick or Acid-Test Ratio 3) Current Cash Debt Coverage Activity 4) Accounts Receivable Turnover 5) Inventory Turnover 6) Asset Turnover Profitability 7) Profit Margin on Sales 8) Return on Assets 9) Return on Common Stockholders' Equity 10) Earnings per Share 11) Payout Ratio (common) Coverage 12) Debt to Assets Ratio 13) Times Interest Earned Ratio 14) Cash Debt Coverage 15) Book Value per Share
Step by Step Solution
There are 3 Steps involved in it
Step: 1
Get Instant Access to Expert-Tailored Solutions
See step-by-step solutions with expert insights and AI powered tools for academic success
Step: 2
Step: 3
Ace Your Homework with AI
Get the answers you need in no time with our AI-driven, step-by-step assistance
Get Started