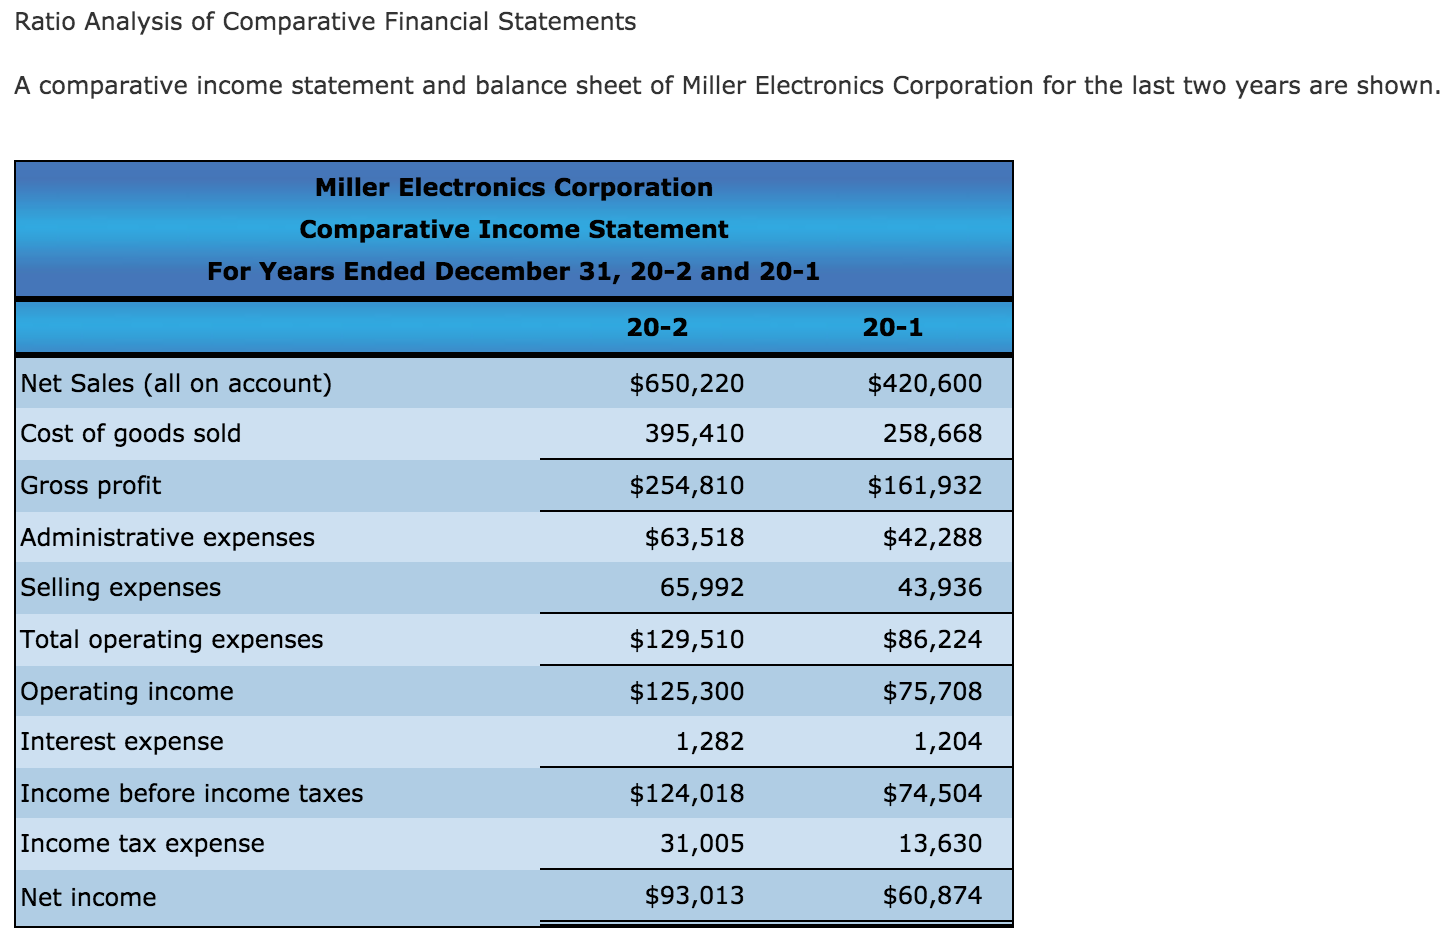
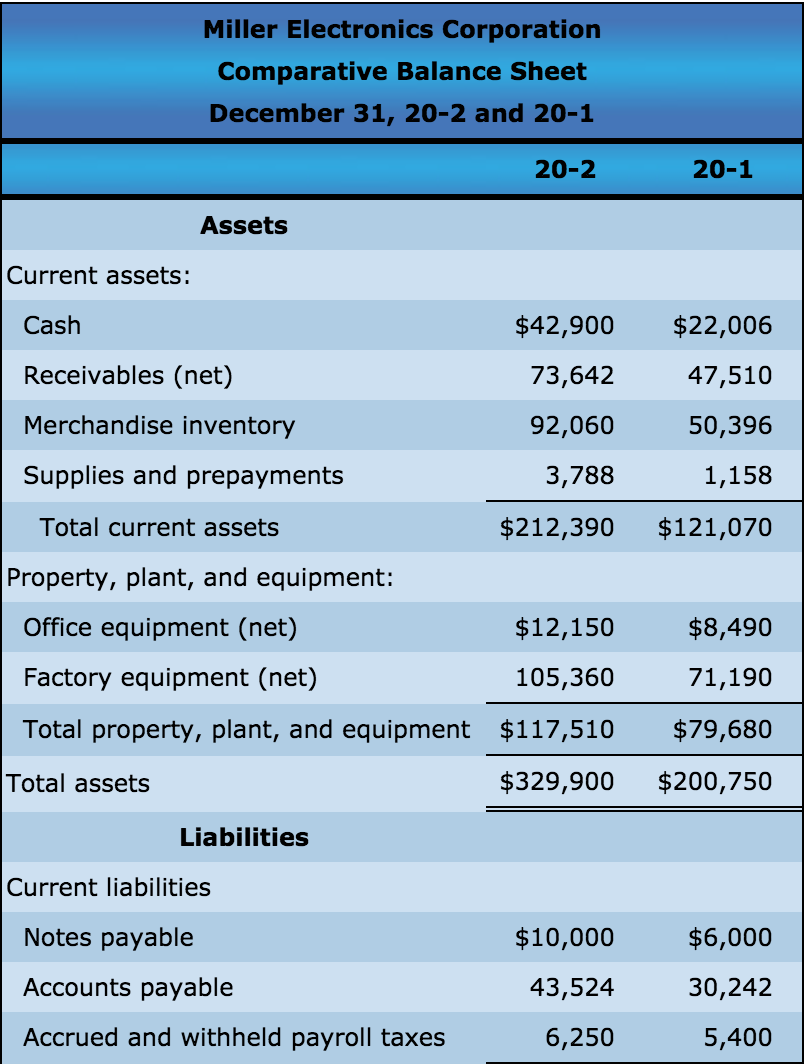
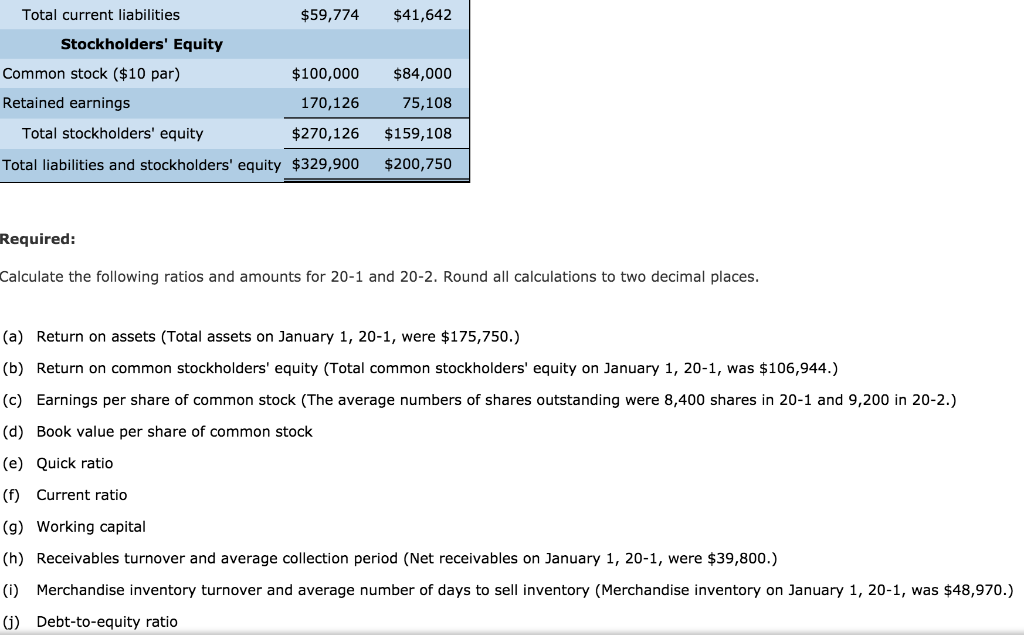
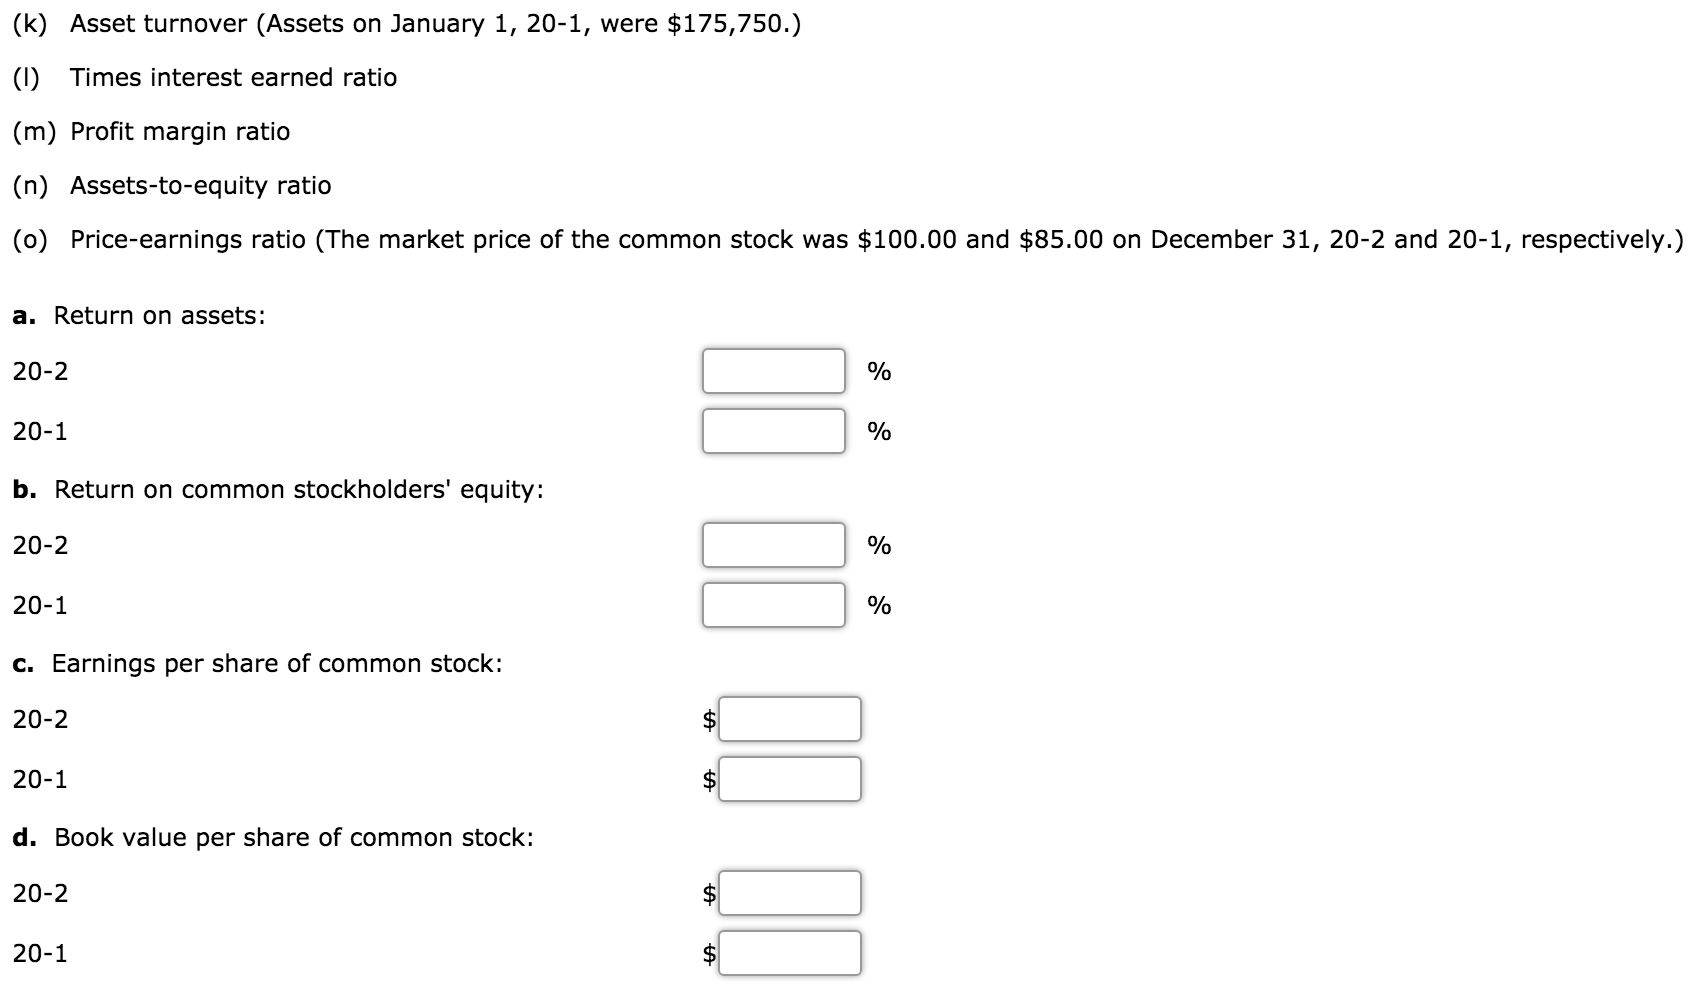
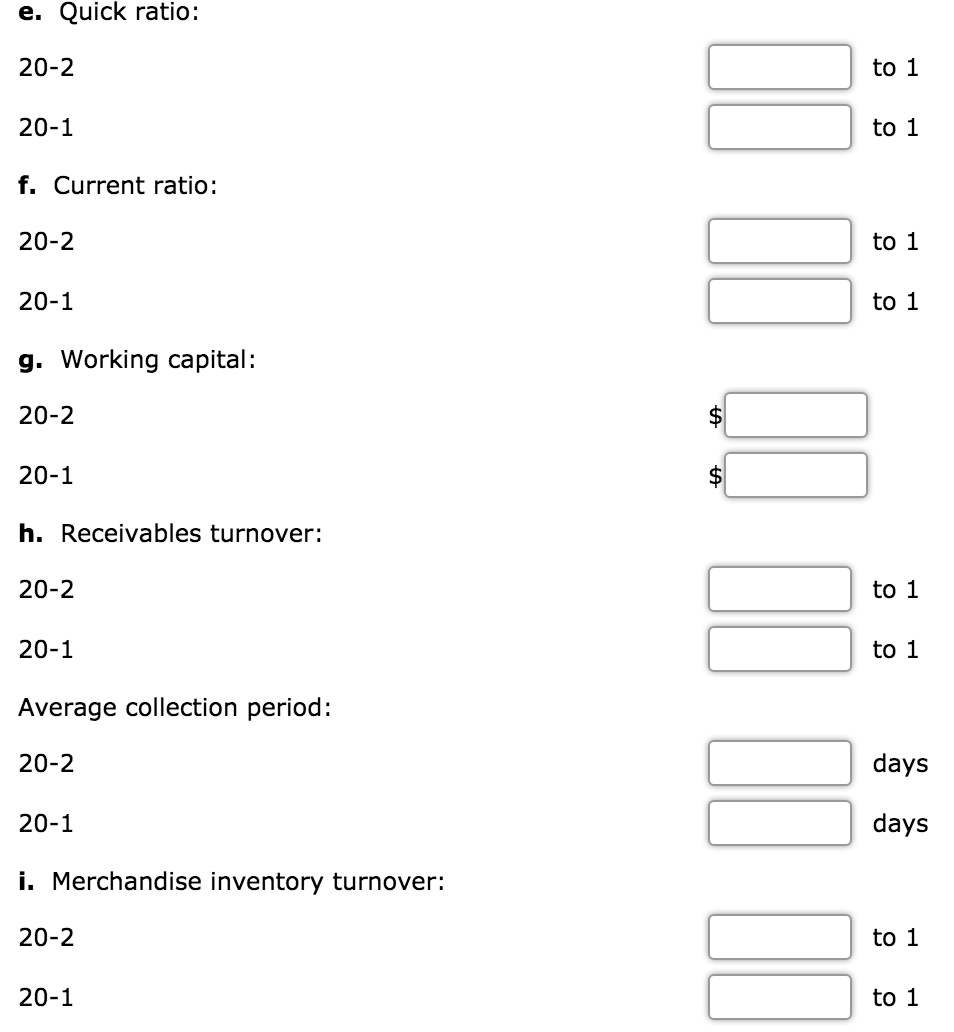
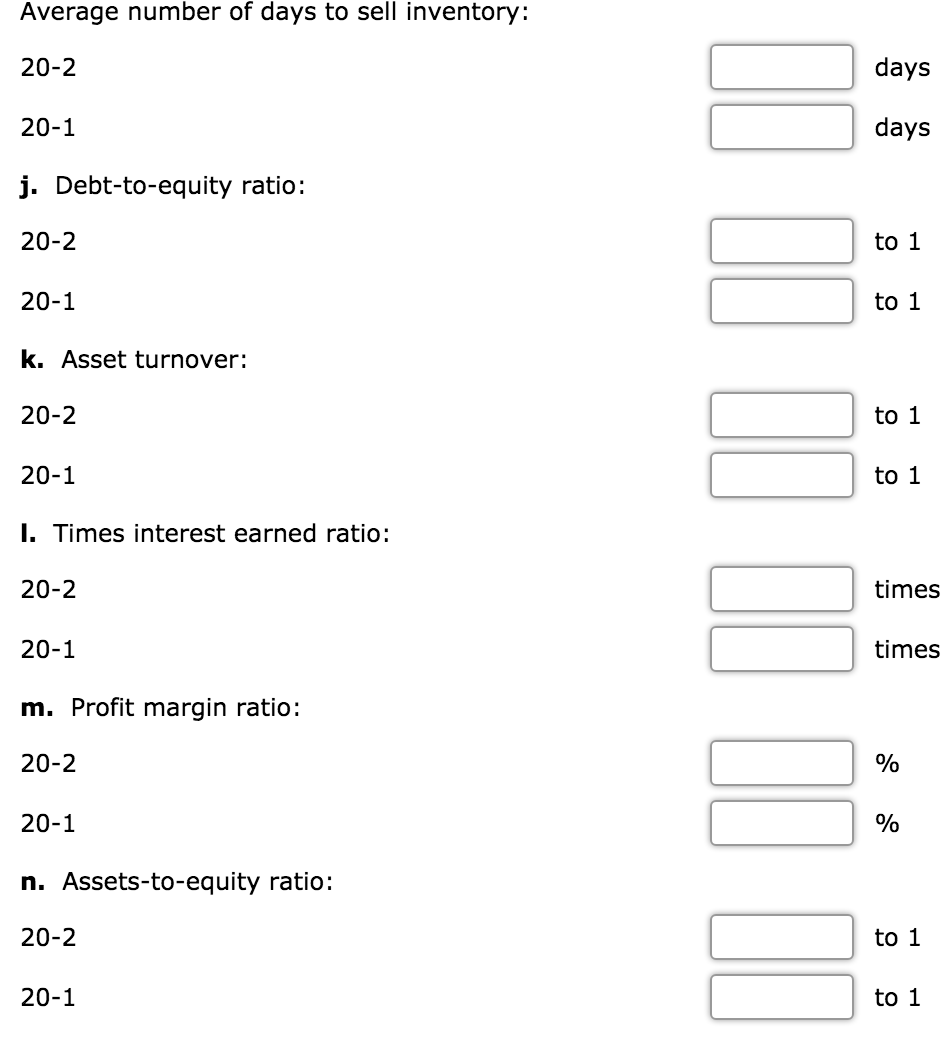

Ratio Analysis of Comparative Financial Statements A comparative income statement and balance sheet of Miller Electronics Corporation for the last two years are shown. Miller Electronics Corporation Comparative Income Statement For Years Ended December 31, 20-2 and 20-1 20-2 20-1 Net Sales (all on account) Cost of goods sold Gross profit $420,600 258,668 $161,932 Administrative expenses $42,288 $650,220 395,410 $254,810 $63,518 65,992 $129,510 $125,300 1,282 Selling expenses 43,936 Total operating expenses Operating income $86,224 $75,708 1,204 Interest expense Income before income taxes $74,504 Income tax expense $124,018 31,005 $93,013 13,630 Net income $60,874 Miller Electronics Corporation Comparative Balance Sheet December 31, 20-2 and 20-1 20-2 20-1 Assets Current assets: $22,006 47,510 50,396 1,158 $121,070 Cash $42,900 Receivables (net) 73,642 Merchandise inventory 92,060 Supplies and prepayments 3,788 Total current assets $212,390 Property, plant, and equipment: Office equipment (net) $12,150 Factory equipment (net) 105,360 Total property, plant, and equipment $117,510 Total assets $329,900 $8,490 71,190 $79,680 $200,750 Liabilities Current liabilities Notes payable $10,000 43,524 $6,000 30,242 Accounts payable Accrued and withheld payroll taxes 6,250 5,400 $41,642 Total current liabilities $59,774 Stockholders' Equity Common stock ($10 par) $100,000 Retained earnings 170,126 Total stockholders' equity $270,126 Total liabilities and stockholders' equity $329,900 $84,000 75,108 $159,108 $200,750 Required: Calculate the following ratios and amounts for 20-1 and 20-2. Round all calculations to two decimal places. (a) Return on assets (Total assets on January 1, 20-1, were $175,750.) (b) Return on common stockholders' equity (Total common stockholders' equity on January 1, 20-1, was $106,944.) (c) Earnings per share of common stock (The average numbers of shares outstanding were 8,400 shares in 20-1 and 9,200 in 20-2.) (d) Book value per share of common stock (e) Quick ratio (1) Current ratio (9) Working capital (h) Receivables turnover and average collection period (Net receivables on January 1, 20-1, were $39,800.) (0) Merchandise inventory turnover and average number of days to sell inventory (Merchandise inventory on January 1, 20-1, was $48,970.) 6) Debt-to-equity ratio (k) Asset turnover (Assets on January 1, 20-1, were $175,750.) (1) Times interest earned ratio (m) Profit margin ratio (n) Assets-to-equity ratio (0) Price-earnings ratio (The market price of the common stock was $100.00 and $85.00 on December 31, 20-2 and 20-1, respectively.) a. Return on assets: 20-2 20-1 b. Return on common stockholders' equity: 20-2 20-1 c. Earnings per share of common stock: 20-2 A 20-1 LA d. Book value per share of common stock: 20-2 20-1 $ A e. Quick ratio: 20-2 20-1 f. Current ratio: 20-2 20-1 g. Working capital: 20-2 20-1 h. Receivables turnover: 20-2 to 1 20-1 to 1 Average collection period: 20-2 days days 20-1 i. Merchandise inventory turnover: 20-2 to 1 20-1 Average number of days to sell inventory: 20-2 days 20-1 days j. Debt-to-equity ratio: 20-2 20-1 k. Asset turnover: 20-2 20-1 I. Times interest earned ratio: 20-2 times 20-1 times m. Profit margin ratio: 20-2 20-1 n. Assets-to-equity ratio: 20-2 20-1 0. Price-earnings ratio: 20-2 20-1